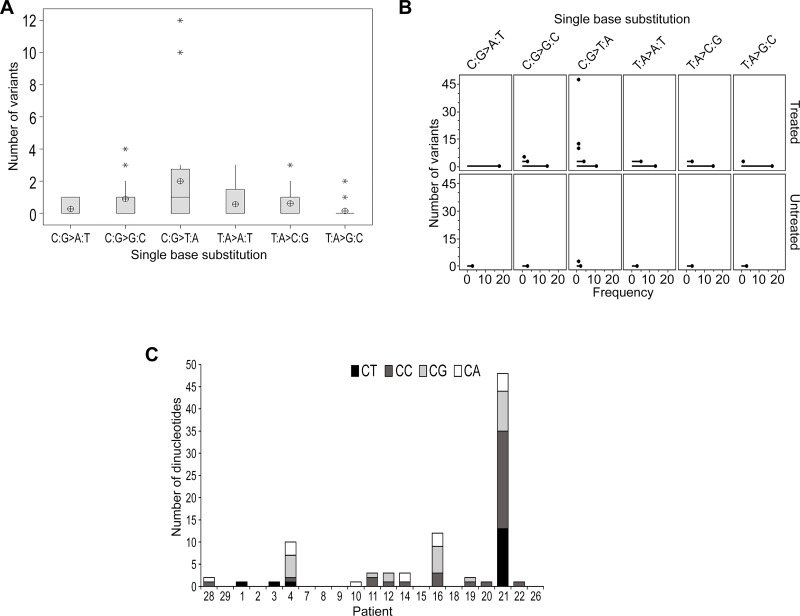
Figure 3. TMZ-induced mutational events were not evident in the majority of samples at recurrence.
(A) Boxplot representing the distribution of single base substitutions unique to recurrence. The y-axis excludes patient 21 as an outlier with 48 detected variants. The mean is shown as a circular symbol and the asterisks highlight outliers. (B) An individual value plot presenting the spread of single base substitutions occurring uniquely at recurrence and the frequency of patients in which they occur. Substitutions detected in treated patients (including patient 21) and untreated patients are highlighted. (C) Total number of C:G > T:A substitutions and the proportion of each dinucleotide context.

