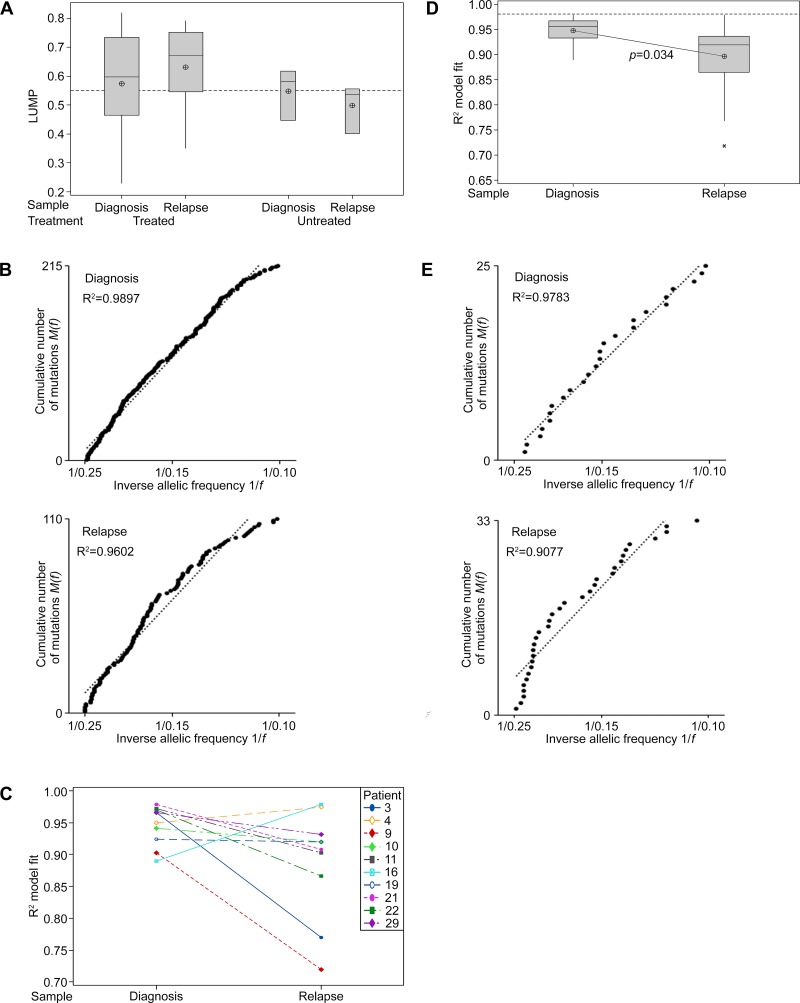
Figure 4. Neutral tumor evolution was evident in untreated GBM, however, a shift away from effectively-neutral subclone dynamics was observed after radiochemotherapy.
(A) Boxplot presenting the estimated purity of samples determined by LUMP analysis. The line of short dashes indicates the 55% purity threshold for inclusion in neutral evolution analyses. (B) The cumulative distribution M(f) of subclonal mutations in primary tumors prior to therapy analyzed collectively was linear with the inverse of their frequency (1/f) (upper panel) and a shift away from linearity and therefore neutral evolution was evident in tumors after treatment at recurrence (lower panel; excludes patient 21 recurrent sample). A stringent R2 > 0.98 defines neutral evolution in these collective analyses. (C) Subclonal mutations of individual samples were assessed and the variation between tumors at diagnosis and relapse are presented for the 10 paired samples analyzed. R2 goodness-of-fit measures for the neutral evolution model decrease from diagnosis to recurrence in 80% of paired samples from the same patient. (D) Boxplot of the R2 goodness-of-fit for the neutral evolution model. Subclonal mutations of individual samples were assessed and the variation between tumors at diagnosis and relapse are presented for all samples analyzed. The line of short dashes indicates the R2 = 0.98 threshold used to distinguish neutral and non-neutral evolution. A two-way analysis of variance was performed using the general linear model for continuous variables and the corresponding p-value is displayed. (E) The cumulative distribution M(f) of subclonal mutations in the primary tumor (upper panel) and relapse tumor (lower panel) of patient 21. A switch from neutral to non-neutral evolutionary dynamics was apparent between tumors at diagnosis and relapse.

