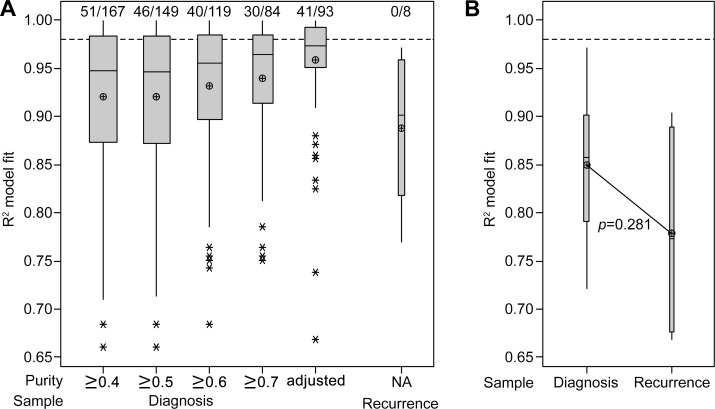
Figure 5. Interrogation of publically available datasets also indicates a stronger fit to the neutral evolution model in untreated primary tumors.
(A) Boxplot of the R2 goodness-of-fit for the neutral evolution model, presenting data from cohort 2. The minimum purity level of included samples is categorized below the x-axis and the 93 samples which satisfied inclusion criteria for analysis using purity-adjusted VAFs are compared. The line of short dashes indicates the R2 = 0.98 threshold used to distinguish neutral and non-neutral evolution and the number of samples greater than this threshold out of the total number analyzed in each category is indicated above the dashed line. (B) Boxplot of the R2 goodness-of-fit for the neutral evolution model, presenting data from cohort 3. The line of short dashes indicates the R2 = 0.98 threshold. A two-way analysis of variance was performed using the general linear model for continuous variables and the corresponding p-value is displayed.

