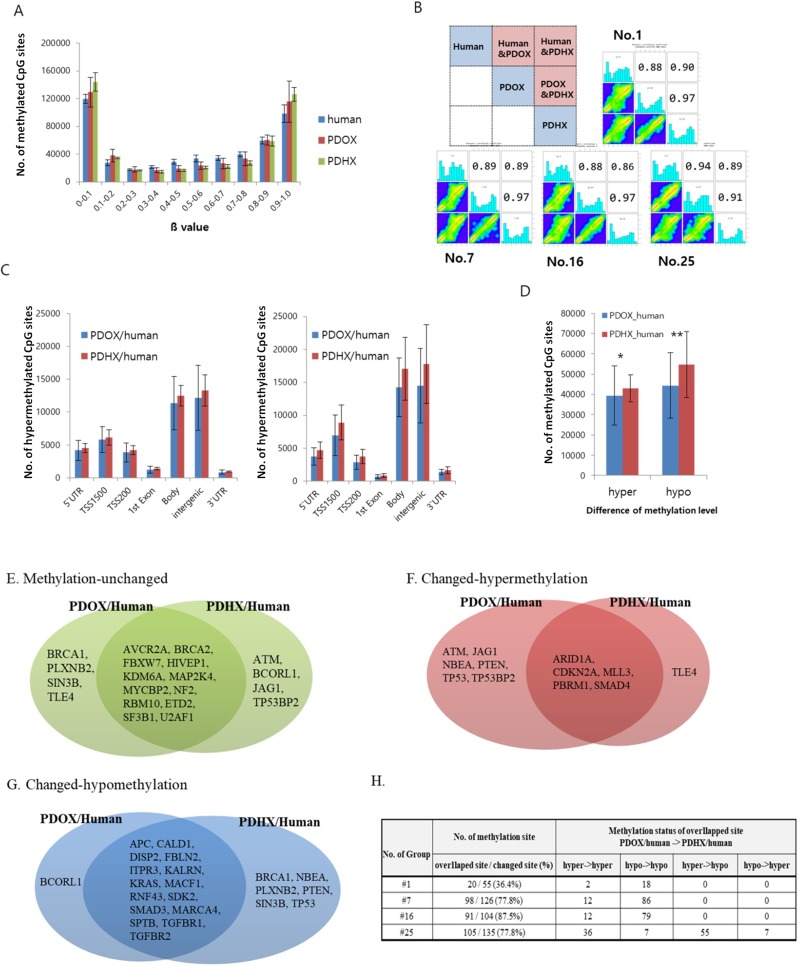
Figure 3. Comparative analysis of DNA methylation arrays between original patient tumors and PDOX and PDHX.
(A) Distribution of methylation levels by group; β values are grouped in 0.1 increments and the percentage of probes is represented for each sample type. (B) Pearson's correlation analysis. Of the total methylation sites, 1000 sites were randomly selected. As shown in the box at the top left, the methylation patterns of the original patient tumors, PDOX, and PDHX were compared. The analysis was performed for four human–PDOX and PDHX sets. (C) Methylation intensity by genomic compartment. The delta value was calculated by analyzing the methylation-intensity difference between the comparison subjects; hypermethylation was defined as delta ≥ −0.2 and hypomethylation was defined as delta ≤ −0.2. Each methylation level was compared according to the genomic compartment. (D) Methylation intensity between two groups. Genomic compartments were not distinguished, and the overall intensity was analyzed together (*p = 0.678; **p = 0.401). (E–G) Comparison of methylation changes for cancer-specific genes: (E) unchanged, (F) hypermethylation, (G) hypomethylation. (H) Comparison of methylation patterns for methylation-changed sites.

