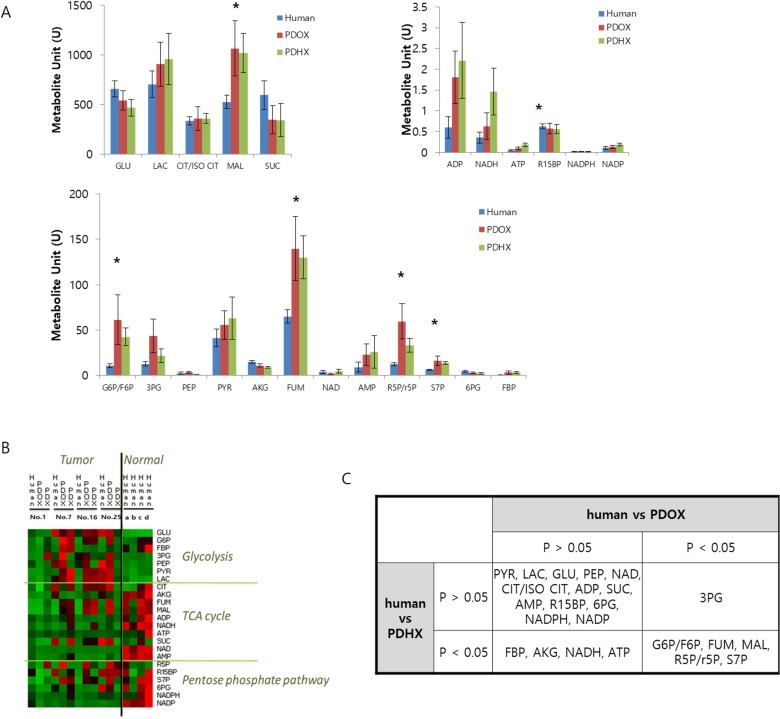
Figure 4. Comparative analysis of metabolite profiling between original patient tumors and PDOX and PDHX tumors.
(A) Quantitative comparison of 23 metabolites in the original patient tumor, PDOX, and PDHX tumor tissues. (*p < 0.05) (B) Heatmap analysis of metabolites in original patient normal or tumor tissues and PDOX/PDHX tumors. (C) Statistical analysis of PDOX and PDHX metabolites, based on the human-metabolite results.

