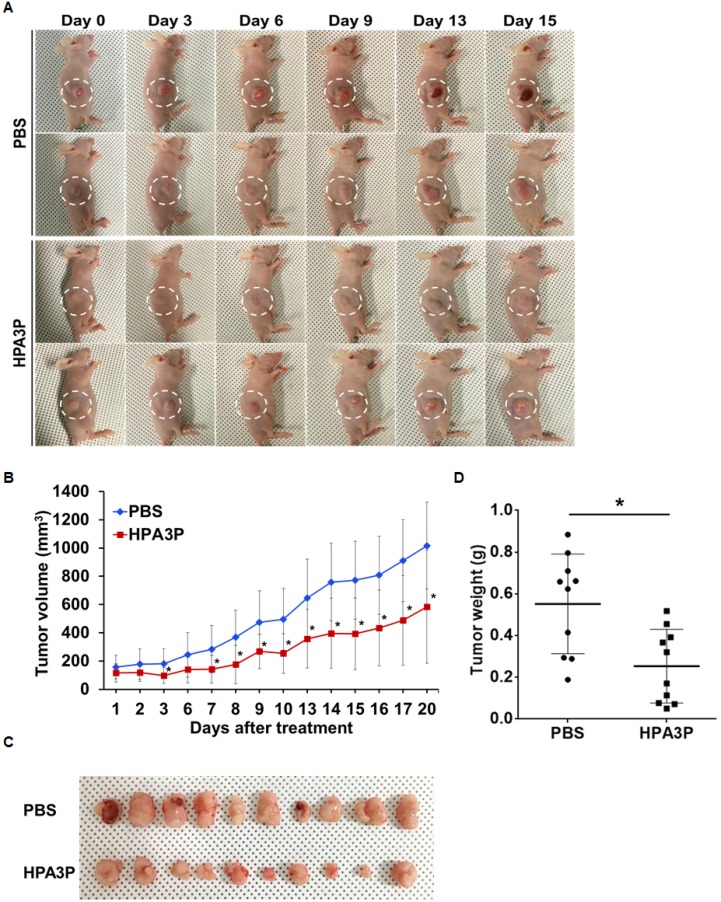
Figure 6. HPA3P inhibits tumour growth in mouse tumour models.
HCT116 p53+/+ cells were injected into the right flanks of the nude mice. Ten days after implantation, the mice were treated with 25 mg/kg HPA3P and PBS by intravenous injection. (A) Representative images were photographed, and (B) tumour volumes were measured on the indicated date. The data are presented as the mean ± SD, n = 10 per group. *p < 0.05. (C) Images were obtained, and (D) tumour weights were measured on day 20 after tumour resection. The tumour weights are presented as scatter dot data. The data are presented as the mean ± SD, n = 10 per group. *p < 0.05 compared with PBS.

