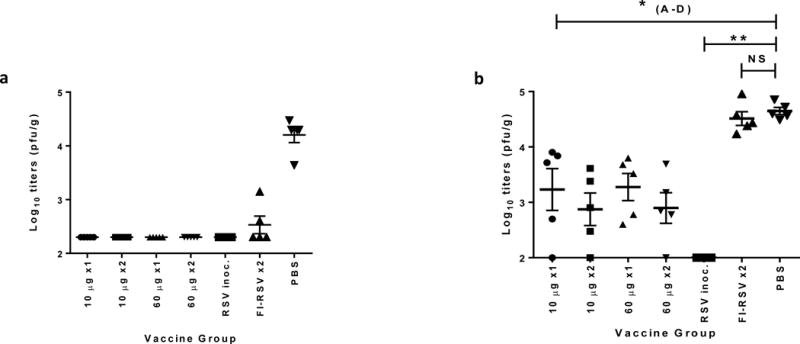
Figure 3. ID delivery of pGX2303 provides protection against upper and lower respiratory tract disease.

Groups A-G (Cotton rats (5 per group)) were treated as outlined in Table 1. Group I received PBS IM as a negative control. All animals were challenge with 1×10⁵ pfu of RSV/A delivered IN on day 28. On day 33 animals were sacrificed and lung (a) and nasal (b) viral titers were measured in tissue homogenates by HEp2 cell line plaque assay. Data points represent pfu’s per g of lung tissue expressed as Log10 titers. Horizontal lines represent mean titer per group and error bars +/− SEM. * p<0.05 in comparison to negative control (Grp. G).
Abbreviations: Pfu, plaque-forming unit; g, gram; SEM, standard error of the mean; ns, non-significant.
