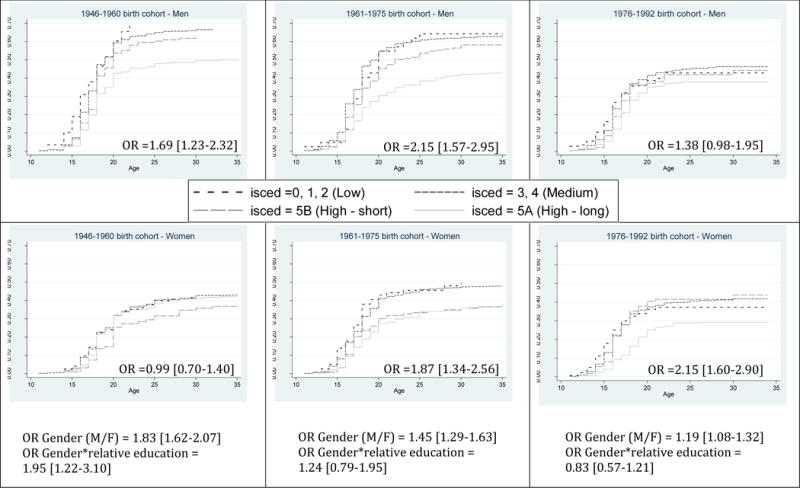
Figure 3. Proportion having ever smoked regularly by age in the different educational groups – Germany.

Isced=0, 1, 2 (Low) to 5A (High - long): educational level (see Measures section)
OR = adjusted OR for relative education with controls (age in 2010, follow-up, follow-up2, native born, and citizen), i.e. RII
OR Gender (M/F) = adjusted OR for gender (male relative to female) with controls (and relative education)
OR Gender* relative education= adjusted OR for gender*relative education with controls (i.e., RII for males relative to females)
