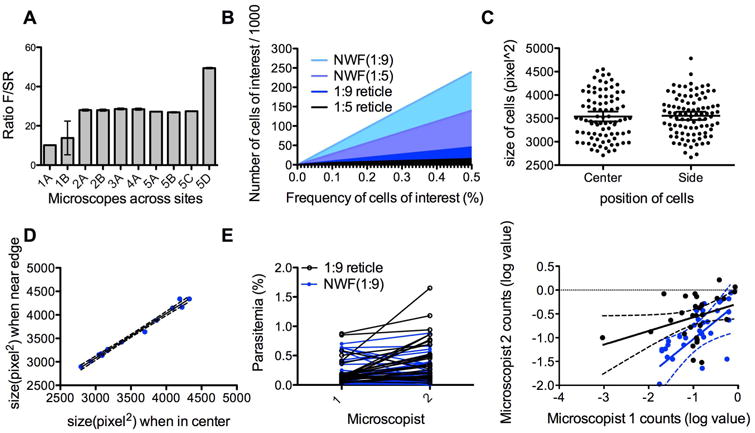
Figure 4. An approach for calculating cells of low frequency with increased accuracy.

(A) Ratio of the areas of the small square (SR) of the reticle and the whole field circle (F) for microscopes at different study sites. This ratio can be used to determine the correct reticle factor for each microscope-reticle combination. Measurements were done 2-5 times for each microscope. Error bars indicate 95% Confidence Interval. (B) Estimated number of target cells observed when counting a total of 1000 cells using different methods (reticle method with a 1:5 or 1:9 reticle, and NWF method using a 1:5 or 1:9 reticle). (C) To test whether there is distortion at the edge of the pictures taken for analysis, sizes of the cells at the center (in reticle) of the field and at the edge of the field were measured. Measurements were made in at least three separate fields, using three different microscopes. The graph is from one representative microscope. (Median and standard deviation values for cells in the center versus side :3269.5± 541.5 vs 3341.5 ±517.654) Error bars indicate 95% Confidence Interval. (D) Pictures were taken of the same cells at different positions (in center of field or at edge) and the sizes of the cells analyzed. Dotted lines represent the 90% range. (Median and standard deviation values for cells in the center versus side : 3468 ± 491.2 vs 3584 ± 428.3 (E) Counts of two microscopists (1 and 2) were compared when using the 1:9 reticle (black) or the NWF method (blue). The left graph is a direct comparison of individual values using the two methods. The right graph shows the linearity between the counts. The parasitemia values were log-transformed for better comparison. The correlation between the two microscopists' counts is greater using the NWF method (Pearson r: 0.6654, p < 0.0001 for NWF, r:0.3898, p=0.03 for 1:9 reticle). Dotted lines represent the 95% Confidence Interval.
