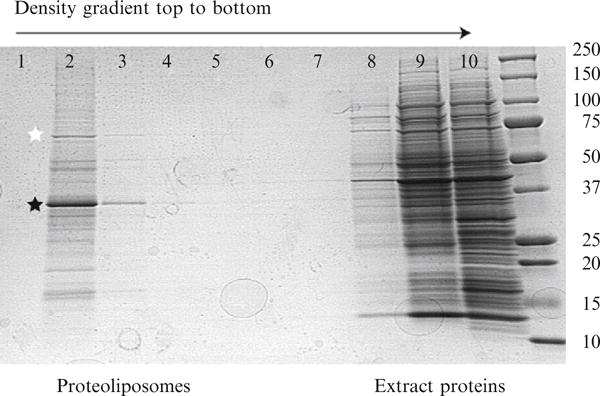
Figure 37.5.

Denaturing PAGE analysis of the density gradient obtained after cell-free translation of hSCD1. The order of fractions from the density gradient is indicated. hSCD1 (black star) and a plant Hsp70-like protein (white star) are noted in lane 2, which represents the interface between the upper buffer (lane 1) and the remainder of the 30% Accudenz layer. The majority of wheat germ extract proteins remain in the 40% Accudenz layer. The rightmost lane contains molecular weight markers (kDa, noted alongside image). Adapted from Goren and Fox (2008).
