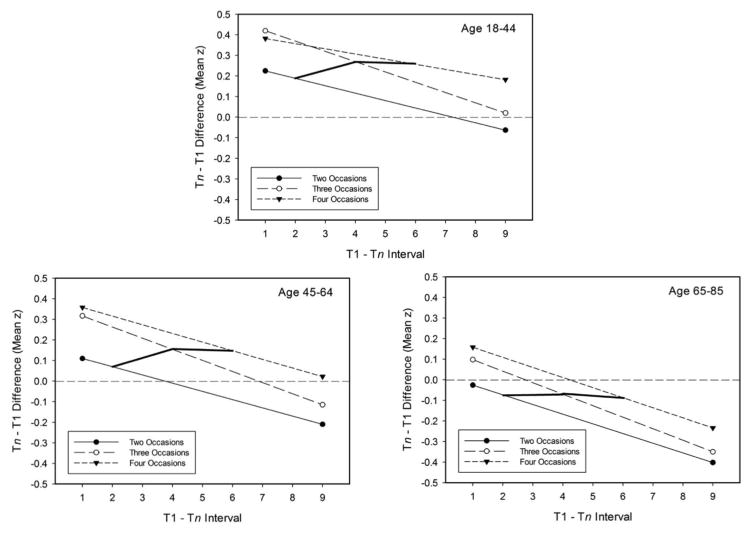
Figure 3.
Regression lines relating T2-T1 change in mean z-score units to interval in years between occasions with either 2, 3, or 4 occasions. The three panels portray results with adults in three age groups. The solid lines portray the values of expected change if measurements were obtained every 2 years.

