
Figure 2.
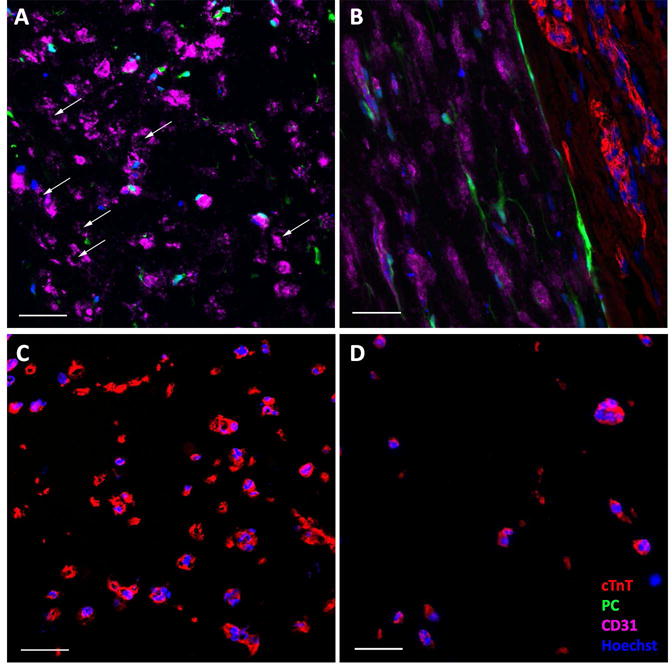
Immunofluorescence characterization of patches before implantation. A) Cross-section of BPC layer of bi-layer patch. White arrows indicating microvessel lumens. B) Longitudinal section of bi-layer patch showing interface between the two layers and the alignment of both CMs (cTnT) and microvessels (CD31). C) Cross-sectional view of CM layer of bi-layer patch compared to time-matched D) cross-sectional view of CM-only patch. Abbreviations: cTnT, cardiac troponin-T; PC, pericytes. Color of labels is consistent in all panels. Scale bars = 50 μm.