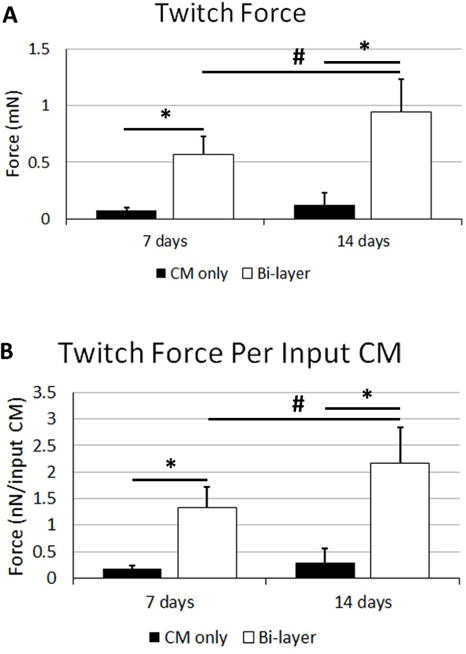
Figure 3.

Twitch force characterization of patches before implantation. Twitch force A) and twitch force normalized to the number of CMs seeded into the gels during gel formation B). Significance is indicated by horizontal bars between groups, p<0.05.
