
Figure 5.
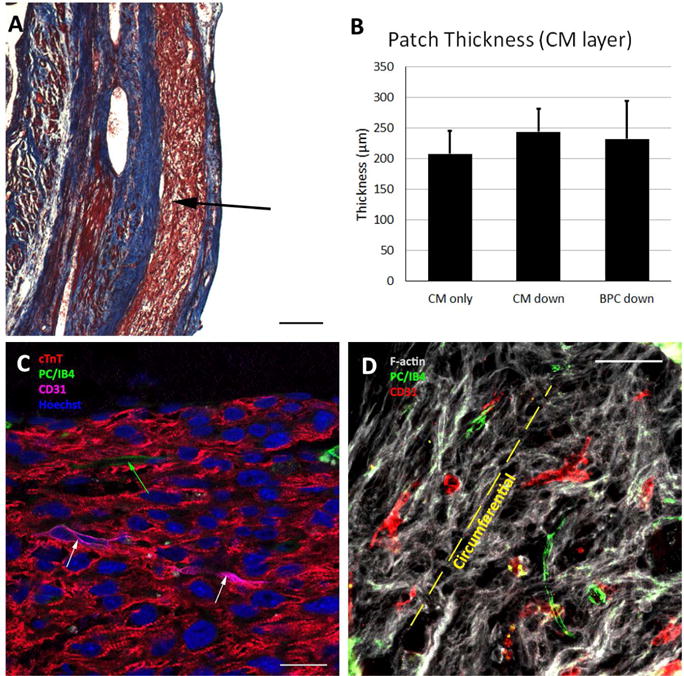
Patch engraftment four weeks after implantation. A) Masson’s trichrome image showing patch on the epicardium (arrow). Scale bar = 200 μm. B) Patch thickness for each of the three implant groups, where “CM down” and “BPC down” refers to the orientation of the implanted bi-layer patches. C) High magnification image of patch showing dense CM layer and sarcomeric banding. White arrows indicate human microvessels and green arrow indicates rat microvessel that have sprouted into the CM patch. Scale bar = 20 μm D) F-actin stain indicating alignment of CMs in the circumferential direction. Rat and human microvessels generally co-align with the CMs. Scale bar = 50 μm. Abbreviations: cTnT, cardiac troponin-T; PC, pericytes; IB4, fluorescein conjugated griffonia simplicifolia I, isolectin B4.