
Figure 7.
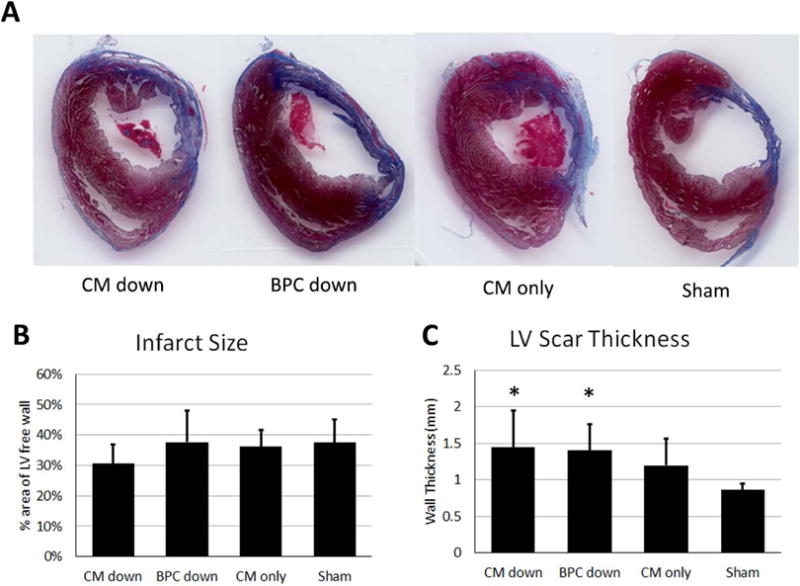
Characterization of scar four weeks after infarction based on Masson’s trichrome images. A) Representative images of the LV scar from the four groups. B) Scar size in terms of the percent area of the LV free wall it occupies. C) LV wall scar thickness. * indicate significantly difference than sham, p<0.05.