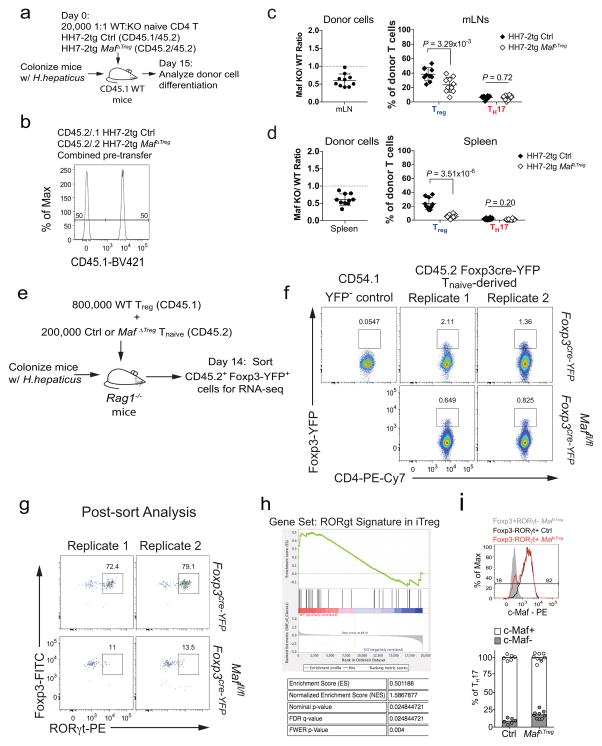
Extended Data Figure 7. Analysis of c-Maf function in RORγt+ iTreg cells.
a–d, Equal numbers of congenic isotype-labeled naïve Maf+/+;Foxp3cre (Ctrl, CD45.1/45.2) and Maffl/fl;Foxp3cre (CD45.2/45.2) HH7-2tg cells were co-transferred into H. hepaticus-colonized WT CD45.1 mice. Cells from the LILP, mLNs and spleen were analyzed 15 days after transfer. a, Schematic of experimental design. b, Flow cytometry plot depicting ratio of pooled co-transferred naïve T cells prior to transfer. c, d, Left, ratios of MafΔTreg vs control HH7-2tg donor-derived cells in the mLNs and spleen (n=10). Dashed line represents ratio of co-transferred cells prior to transfer. Right, frequencies of Treg (Foxp3+) and TH17 (Foxp3−RORγt+) among donor-derived cells (n=10). Statistics were calculated by unpaired two-sided Welch’s t-test. Error bars: mean ± 1 SD. P values are indicated in the figure. e–h, Isolation of Maf-deficient and -sufficient iTreg cells for RNA-seq through a T cell reconstitution system. Two replicates represent two independent experiments. e, Schematic of experimental design. f, Flow cytometry plots indicating the sorting gates from two independent experiments. g, Flow cytometry plots showing Foxp3 and RORγt expression in sorted Foxp3-YFP+ cells from two independent experiments. h, Gene Set Enrichment Analysis performed on RNA-seq dataset of c-Maf-sufficient vs. -deficient iTreg (Foxp3-YFP+) cells (n=2 independent experiments) with gene set of 33 RORγt-dependent transcripts identified previously11. i, Top, representative flow cytometry plot of c-Maf expression in TH17 cells (Foxp3− RORγt+) from LILP of control (black) and Maf ΔTreg (red) mice. The c-Maf negative population is defined by gating on Foxp3+RORγt− Treg from MafΔTreg mice (solid grey). Bottom, frequency of c-Maf expression in Th17 cells in control (n=6) and Maf ΔTreg (n=9) mice from 3 independent experiments.

