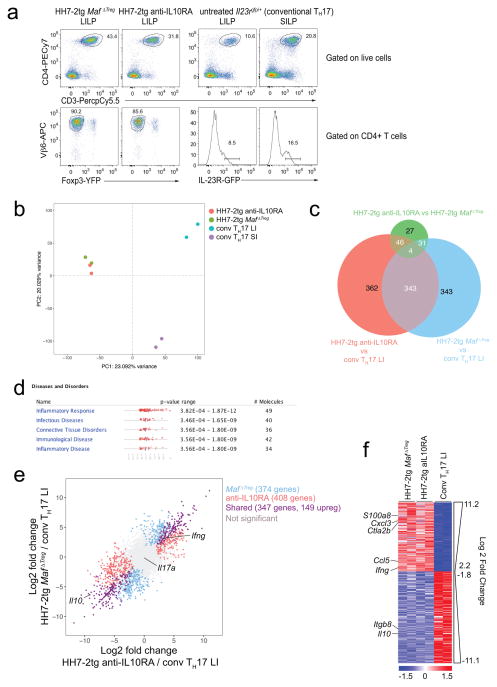
Extended Data Figure 8. Transcriptional profiling of conventional TH17 and H. hepaticus-specific T effector cells.
a–f, RNA-seq was performed on 2 biological replicates of each indicated condition. a, Flow cytometry analysis of HH7-2tg T effector cells from H. hepaticus-colonized mice and conventional IL-23R-GFP+ (predominantly SFB-specific TH17) cells from SFB-colonized mice. GFP+ gates in the lower panel were used for sorting to perform RNA-seq. b, Principal component analysis of RNA-seq data from sorted cell populations. Colored dots represent individual samples (n=2). c, e, f, Differentially expressed genes were calculated in DESeq2 using the Wald test with Benjamini-Hochberg correction to determine FDR. Genes were considered differentially expressed when FDR<0.1 and Log2 fold change > 1.5. c, Venn diagram depicting differentially expressed genes between indicated comparisons. d, Significantly enriched disease pathways in the set of 149 shared genes upregulated in HH7-2tg Maf ΔTreg and HH7-2tg from anti-IL-10RA-treated mice compared to conventional LI TH17. P-values calculated by Ingenuity Pathway Analysis using Fisher’s Exact Test. e, Comparison of transcriptomes of H. hepaticus-specific TH17 cells from mice treated with IL-10Ra blockade or MafΔTreg and conventional TH17 cells. Scatter plot depicting log2 fold change of gene expression. Blue, red and purple dots indicate significant difference. f, Heatmap depicting the 347 shared genes differentially expressed between pathogenic HH7-2 and conventional TH17 cells (purple dots in e). Data for each condition are the mean of 2 biological replicates. Scale bar represents z-scored variance stabilized data (VSD) counts.

