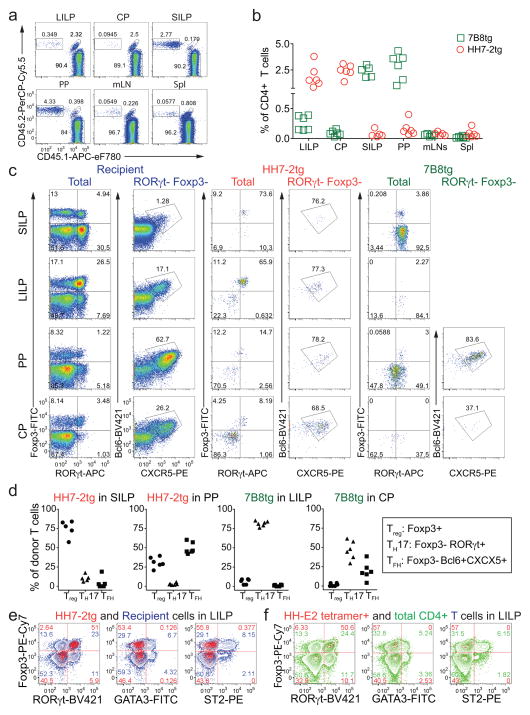
Extended Data Figure 2. Extended characterization of SFB- and H. hepaticus-specific T cells in distinct anatomical sites in bacteria-colonized WT mice.
a, Representative flow cytometry plots of donor-derived HH7-2tg (CD45.1/45.2) and 7B8tg (CD45.2/45.2) T cells in indicated tissues of mice colonized with SFB and H. hepaticus, gated on total CD4+ T cells (CD4+CD3+) (n=15). b, Proportions of donor-derived HH7-2tg and 7B8tg T cells among total CD4+ T cells in indicated tissues. Data in (a) and (b) are from one of 3 experiments, with total of 15 mice in the 3 experiments. c, Representative flow cytometry plots of RORγt, Foxp3, Bcl6 and CXCR5 expression in CD4+ T cells from the host and from HH7-2tg and 7B8tg donors in different tissues (n=15). d, Frequencies of Treg (Foxp3+), TH17 (Foxp3−RORγt+) and TFH (Bcl6+CXCR5+) cells among donor-derived HH7-2tg and 7B8tg cells in different tissues. Data are from one of 3 experiments, with total of 15 mice in the 3 experiments. e, Representative flow cytometry plots of Foxp3, RORγt, GATA3 and ST2 expression in CD4+ T cells from the host (blue) and from HH7-2tg donors (red) in the LILP (n=5). f, Representative flow cytometry plots of Foxp3, RORγt, GATA3 and ST2 expression in total CD4+ (green) and HH-E2 tetramer+ (red) T cells in the LILP (n=5). SILP: small intestinal lamina propria; LILP: large intestinal lamina propria; PP: Peyer’s patches; CP: cecal patches; mLNs: mesenteric lymph nodes; and Spl: spleen.

