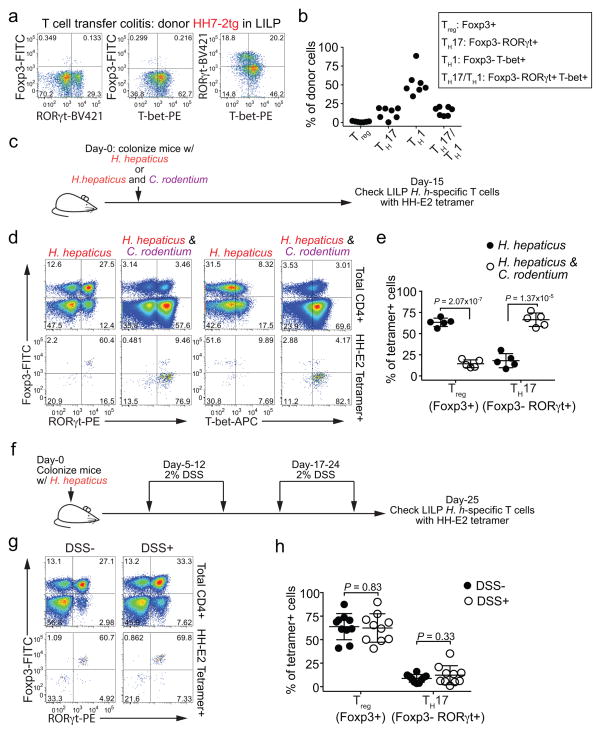
Extended Data Figure 5. Differentiation of H. hepaticus-specific T cells in colitis models.
a, b, Naïve HH7-2tg T cells were adoptively transferred into H. hepaticus-colonized Rag1−/− mice to induce colitis (n=7). Data summarize two independent experiments. Representative expression of Foxp3, RORγt, and T-bet (a), and a compilation of frequencies of Treg (Foxp3+), TH17 (Foxp3−RORγt+), TH1 (Foxp3−T-bet+) and TH17/TH1 (Foxp3−RORγt+T-bet+) in HH7-2tg donor-derived cells in the LILP of recipient mice was analyzed 4 weeks post transfer. c–e, Analysis of H. hepaticus-specific T cell differentiation during C. rodentium-induced colonic inflammation. Data summarize two independent experiments. c, Schematic of experimental design. d, e, Representative flow cytometry plots of Foxp3, RORγt and T-bet expression in total CD4+ and HH-E2 tetramer+ T cells (d) and frequencies of Treg (Foxp3+) and TH17 (Foxp3−RORγt+) cells among HH-E2 tetramer+ T cells (e) in the LILP of C. rodentium-infected (n=5) and -uninfected mice (n=5). f–h, Analysis of H. hepaticus-specific T cell differentiation during DSS-colitis. Data are a summary of two independent experiments. f, Schematic of experimental design. g, h, Representative flow cytometry plots of Foxp3, RORγt and T-bet expression in total CD4+ and HH-E2 tetramer+ T cells (g) and a compilation of frequencies of Treg (Foxp3+) and TH17 (Foxp3−RORγt+) cells among HH-E2 tetramer+ cells (h) in the LILP of DSS-treated (n=10) and -untreated mice (n=10). All statistics were calculated by unpaired two-sided Welch’s t-test. Error bars: mean ± 1 SD. P values are indicated in the figure.

