
Extended Data Figure 9. Effect of hematological cancer-associated mutations of DNMT3A on genomic DNA methylation in the TF-1 leukemia cells.
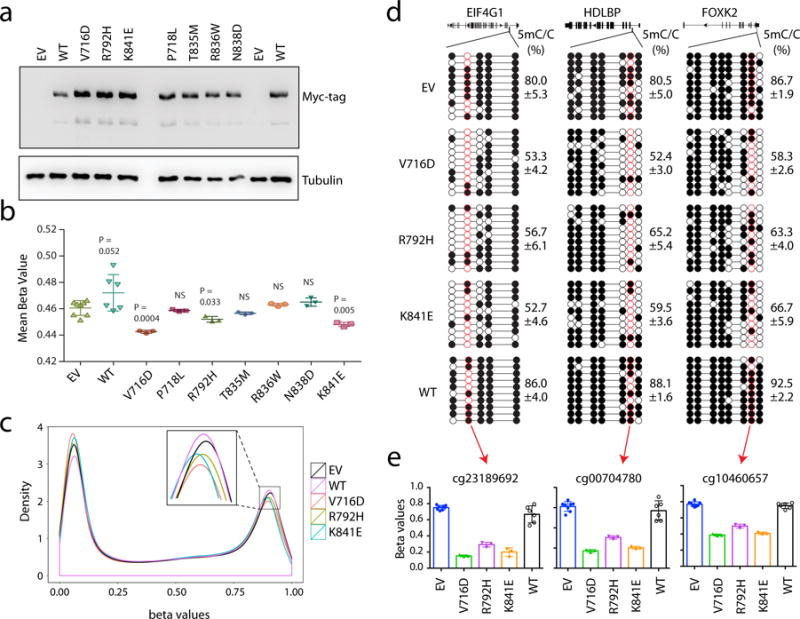
a, Immunoblot of the TF-1 cells stably transduced with Myc-tagged DNMT3A, either WT or the indicated cancer-associated mutants. EV, empty MSCV vector. Shown is a representative blot of two independent experiments. For gel source data, see Supplementary Figure 1. b, Profiling of the indicated DNMT3A-expressing TF-1 cell lines with the HumanMethylation_450K BeadChip array reveals the mean methylation beta values for all examined CpGs. Each dot represents a biological replicate, i.e., an independently derived stable-expression cell line (n = 3-8 biological replicates per group; mean ± s.d.). Statistical analysis used two-tailed Student’s t-test. NS, not significant. c, Density plot of methylation beta values for all examined CpGs in the indicated DNMT3A-expressing TF-1 cell lines. The inserted box shows a zoom-in view for densities for highly methylated DNA sites among the indicated samples. Data are mean ± s.d., with the labeled p values. Statistical analysis used two-tailed Student’s t-test: NS, not significant. d, Sanger bisulfite sequencing of the indicated regions from TF-1 cell lines stably transduced with EV, DNMT3AWT or the indicated cancer-associated mutant. Individual CpG sites (circles) are filled with black (methylated) or white (unmethylated). Red circles denote the CpG sites covered by the Illumina Infinium 450K DNA methylation array. Data are mean ± s.d.; n = 3 biological replicates. e, Methylation values of the indicated CpG sites (labeled by red circles in d) based on the measurements with the Infinium 450K DNA methylation arrays (n = 3-8 biological replicates; mean ± s.d.).