
FIGURE 2. Estimated Resting hs-cTnI Levels by Resting and Stress-Induced Perfusion Defects.
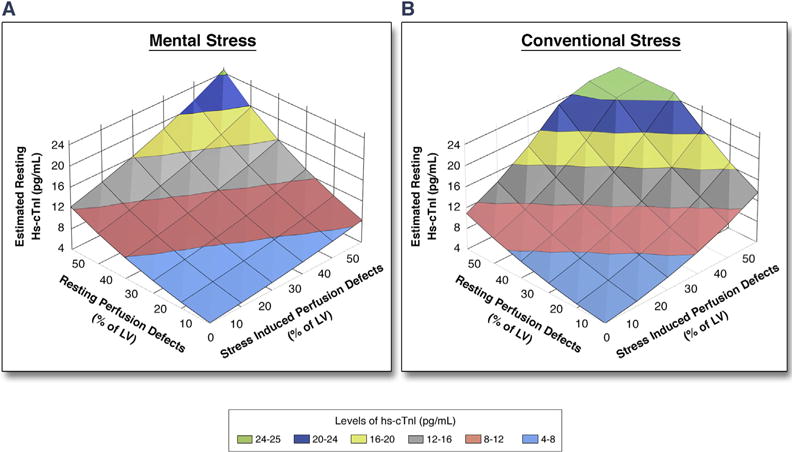
The levels of log-transformed hs-cTnI were estimated with a linear regression model using the extent of resting and stress-induced perfusion defects. The y-axis was back-transformed into regular units of hs-cTnI levels (pg/ml). The estimated levels of hs-cTnI are illustrated by different colors as shown in the color key. For example, with 10% resting perfusion defect, the estimated resting hs-cTnI is 4.7 pg/ml, which increases to 6.1 pg/ml in the presence of concomitant 10% ischemia during conventional stress. Abbreviations as in Figure 1.