Figure 5.

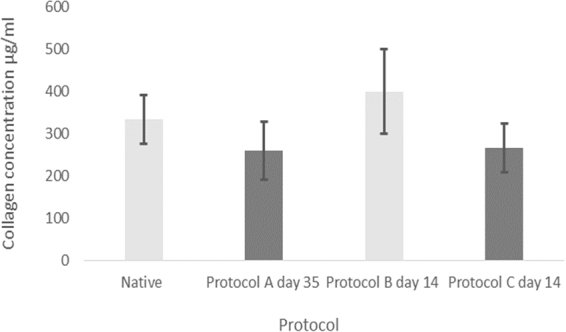
Mean collagen concentration for native samples and the different protocols with error bars for standard deviation. ANOVA analysis (P value: 0.076) indicating no significant difference between the respective study groups.

Mean collagen concentration for native samples and the different protocols with error bars for standard deviation. ANOVA analysis (P value: 0.076) indicating no significant difference between the respective study groups.