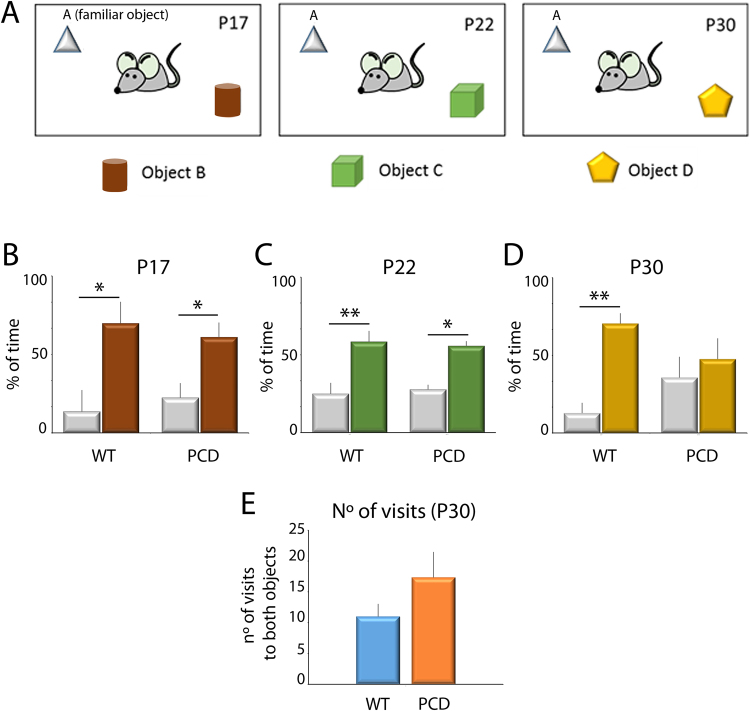
Figure 5.
Analysis of the novel object recognition test along postnatal development. (A) Schematic representation of the test and the objects employed. (B–D) Analysis of the percentage of time exploring familiar and novel objects at different ages for both WT and PCD mice (mean ± SEM); a lack of preference for the new object is seen in PCD mice at P30. (E) Quantification of the number of visits to both objects at P30; no differences were observed. n = 8–9 per experimental group. *p < 0.05; **p < 0.01.

