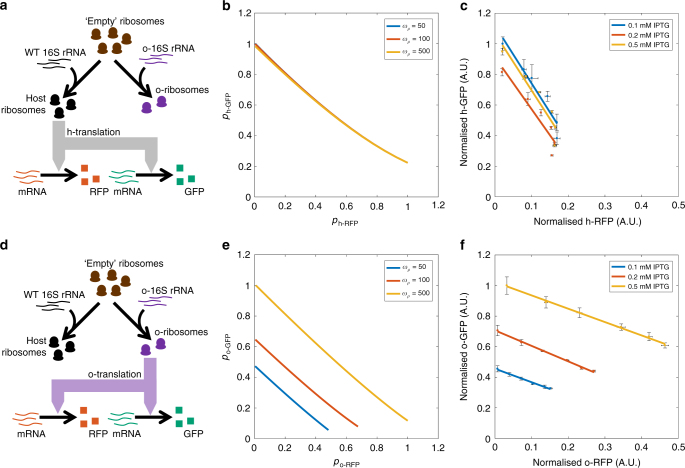
Fig. 2.
Gene coupling in gene circuits utilising either the host or orthogonal ribosome pool. Simulations of the steady-state concentrations of RFP and GFP normalised by the maximum protein production achieved across the o-rRNA transcription rates tested. ωGFP = 100 and ωRFP = 1 to 103 mRNAs per min. o-rRNA production (ωρ) was simulated at the RNAs per min as shown. Experimental data was produced by inducing RFP using AHL from 0 to 20 nM. Points are the mean steady-state fluorescence ± 1 SD normalised by maximum GFP expression obtained across different levels of IPTG treatment. N = 3. Raw data is shown in Supplementary Fig. 8 The isocost line is fit to the mean fluorescence as determined by FACS from cultures during mid-exponential growth (between 3 and 5 h post-induction dependent on the strain and circuit) and the gradient shown in Supplementary Fig. 9. o-ribosome production was induced using three different IPTG concentrations 0.1, 0.2 and 0.5 mM as shown. a Allocation of ribosomes in panels b and c where both circuit genes share the host ribosome pool. b Simulations of circuit using the host ribosome pool. c In vivo protein productions of circuit proteins using the host ribosome pool. FACS profiles shown in Supplementary Fig. 10. d Allocation of ribosomes in panels e and f where both circuit genes share the o-ribosome pool. e Simulations of the circuit using the o-ribosome pool for translation. f In vivo coupling observed in the circuit using the o-ribosome pool. FACS profiles are shown in Supplementary Fig. 11

