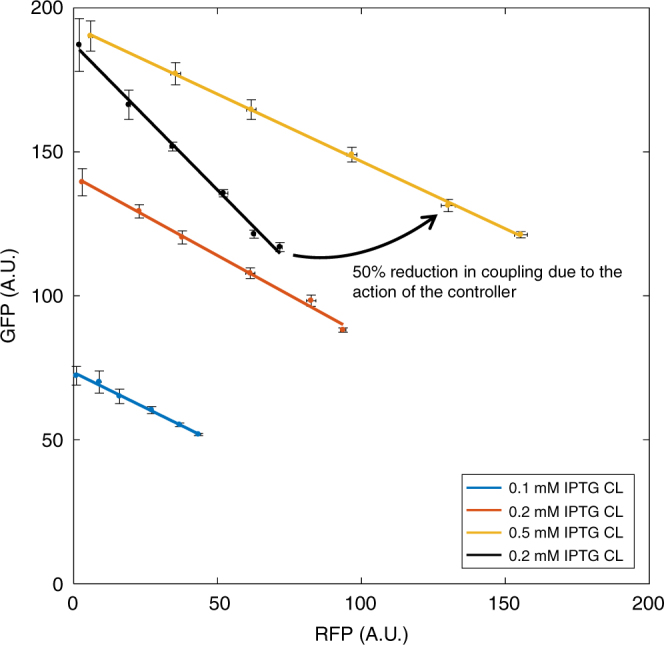
Fig. 7.

In vivo implementation of the prototype controller. Response of constitutively expressed o-GFP as o-RFP is induced. o-RFP was induced using AHL from 0 to 20 nM. Points are the mean steady-state fluorescence ± 1 SD as determined by FACS from cultures during mid-exponential growth (between 3 and 5 h post-induction dependent on the strain and circuit). N = 3. The level of gene expression from the controller can be tuned with IPTG as shown (CL, closed loop). For comparison the o-RFP, o-GFP results which produce comparable initial GFP levels are also shown (OL, open loop). FACS profiles are shown in Supplementary Fig. 26. All OL and CL data is shown in Supplementary Fig. 27. Isocost lines are fit to mean values as described in the ‘Methods’ section and gradients shown in Supplementary Fig. 9
