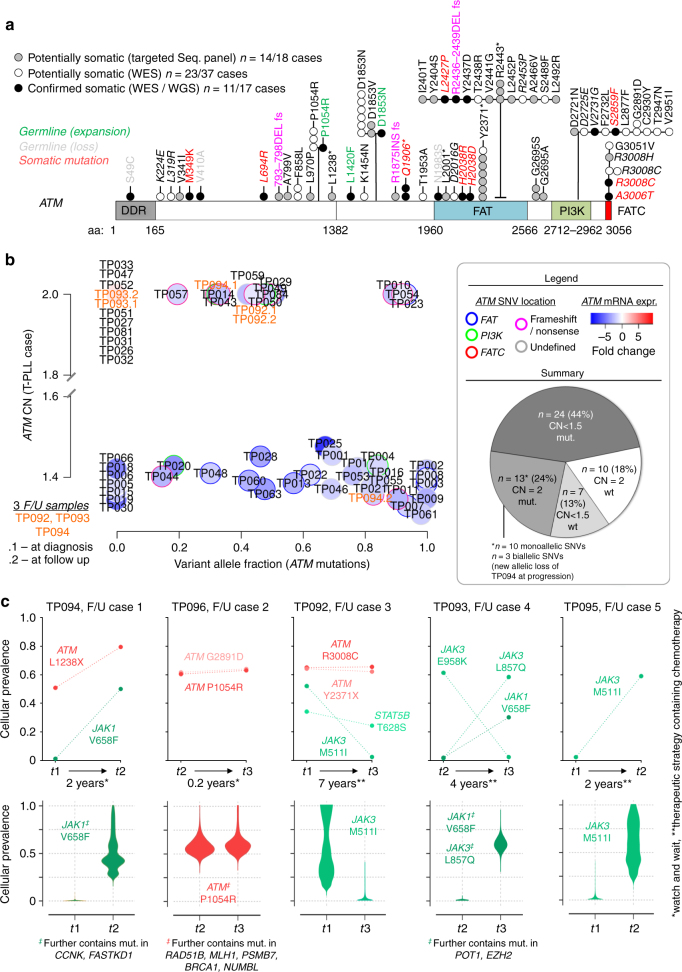
Fig. 5.
ATM sequence variants and dynamics of clonal compositions. a ATM mutations identified in WES (54 cases) and TAS (18 cases) mapped on the schematic polypeptide strand show clustering in the FAT (21/67 (31%) total mutations) and PI3K (11/67 (16%)) domains (* denotes nonsense mutation). See Supplementary Fig. 12a,b for validations and meta-analysis with published ATM mutations in T-PLL. b Integration of ATM CNs, VAFs, and mRNA levels in 54 T-PLL with complete platform overlap (3 sequential samples: TP092, TP093, TP094). Largest subsets among the 44 CNA/mutation affected cases: LOH genotype (enriched FAT domain mutations; p = 0.0079, Fisher’s count test) followed by ATM-mutated/CN-biallelic cases (enriched frameshift or nonsense mutations; p = 0.021, Fisher’s count test). UPDs in 3 cases: TP010, TP023, and TP054. c Five sequential samples analyzed by WES. Top: VAFs for single mutations are copy-number- and contamination-corrected to obtain cellular prevalences based on Bayesian models (PyClone; Supplementary Data 18 for all genes). For illustrative purposes the prevalences of mutations between time points carry dashed connectors for better visual guidance, although such clonal dynamics likely do not follow a strict linear function. There were redundant and prominent changes in relative subclonal ‘sizes’ of JAK1/JAK3/STAT5B variants. The increase in cellular prevalence of ATML1238* in treatment-naive TP094 at t2 was attributable to a loss of the remaining wt-allele (CN < 1.5, Fig. 5b). This was accompanied by a further downregulation of ATM mRNA (fc = −1.63 vs. fc = −2.35). Bottom: Clone sizes of clusters (‡) containing mutations shown in the top panels (identified via PyClone). The JAK3 changes in cases F/U4 and F/U5 corroborate the inverse relationship of JAK3 and ATM variants (Supplementary Fig. 10d). For longitudinal changes in GEP and sCNAs see Supplementary Data 16, 17

