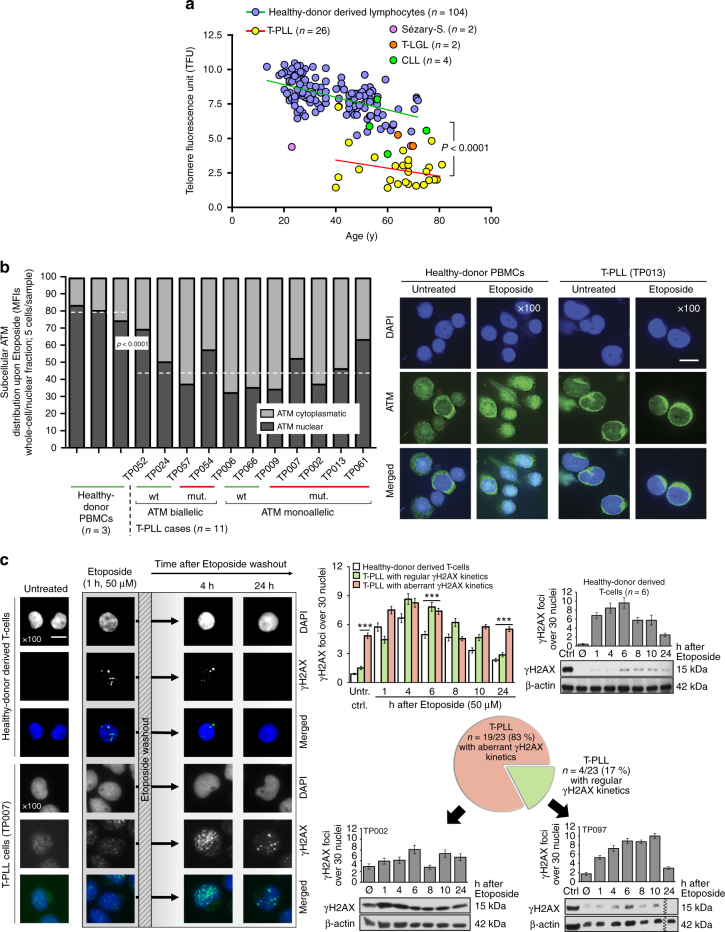
Fig. 7.
T-PLL cells show an aberrant DDR linked to hypofunctional ATM. a Reduced telomere lengths (flow-FISH, age-correlated) in T-PLL (1 telomere fluorescence unit (TFU) corresponds to 1 kb pairs; p < 0.0001, Student’s paired t-test); see also Supplementary Fig. 14a–c for WGS-based analyses and associations with ATM lesions. b Immunofluorescence (IF) microscopy. Impaired nuclear translocalization of ATM in T-PLL upon DSB induction at 1 h exposure to 50 µM Etoposide (independent of genomic ATM status). Left: ImageJ-quantified mean fluorescence intensities (MFIs) for nuclear signals (dashed medians). Healthy-donor PBMCs 78.6% vs. T-PLL 42.5% (p < 0.0001, Student’s t-test). Right: representative samples (scale bar = 5 µm; entire set in Supplementary Fig. 14d). c Aberrant kinetics of DSB-induced foci in T-PLL cells. Left: experimental outline and exemplary IF microscopy (scale bar = 5 µm). Right: summary of quantifications of yH2AX foci (30 nuclei/case; mean with SEM) in 6 samples of healthy-donor T-cells vs. 23 T-PLL with examples represented by individual focus counts over time and immunoblots (mean with SEM; Student's t-test, ***p < 0.0001). Abnormal (not resembling the pattern of normal T cells) formation and kinetics of yH2AX foci in 19/23 T-PLL: hardly any or delayed induction (5/19), as well as inefficient/protracted removal (14/19). In 4 cases the pattern resembled the one of normal T cells (‘regular’). The entire set of yH2AX IF and a summary of densitometries from all immunoblots are provided in Supplementary Fig. 15

