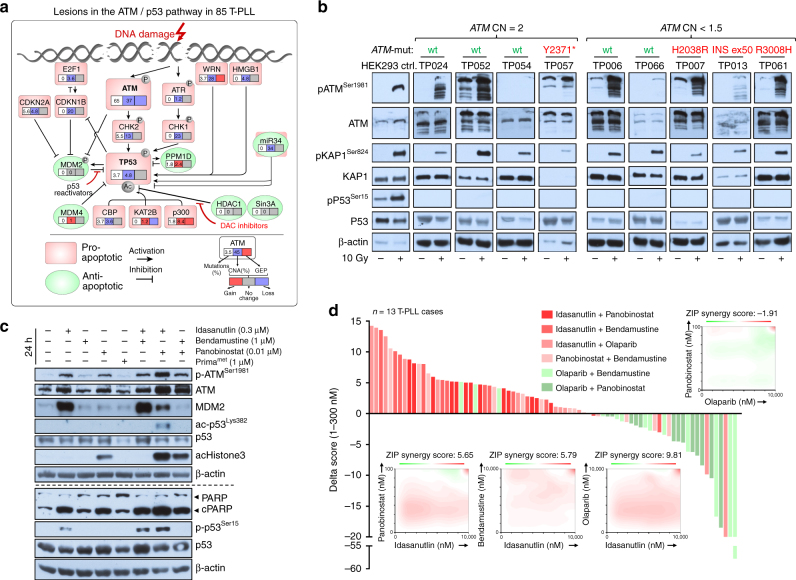
Fig. 9.
Pharmacologic exploitation of the defective ATM/p53 axis. a Summary of genomic lesions (sCNAs, mutations) and gene expression changes affecting TP53 and its direct regulatory network detected in this series of T-PLL. b ATMSer1981, KAP1Ser824, and p53Ser15 phosphorylation upon 10 Gy ionizing irradiation in 9 T-PLL; controls: ATM/P53-competent HEK293 cells. Robust pKAP1 induction (e.g., TP052; ATM-wt/CN = 2), as well as reduced activation is observed (e.g., TP007; ATM-mut/CN = 1.5). Despite at least weak pATM/pKAP induction for most cases, none showed a pP53 response (irrespective of genomic ATM status). All cases lacked 17p sCNAs and TP53 mutations. Median purity: 97.5% T cells; lanes separated for genotype-based arrangement (* denotes nonsense mutation). For results on CHEK2 phosphorylation in a subset of cases see Supplementary Fig. 19a. c Idasanutlin (0.3 µM) reinstated phospho- and acetyl-marks of p53 activity in T-PLL cells. Co-treatment with Bendamustine (1 µM) or Panobinostat (0.01 µM) further enhanced this, including the apoptotic response (cleaved PARP). Immunoblot of case TP104 (representative of 3) at 24 h. There was no p53 phospho-activation by Prima-1met, a selective reactivator of mutated p53 (Supplementary Fig. 19b). d In vitro screen for interactions of Idasanutlin (I), Panobinostat (P), Bendamustine (B), and Olaparib (O) across 13 T-PLL. Each of the 6 combinations was plated in a matrix of 7 concentrations covering a 1000-fold range. Incubation of samples in duplicates for 72 h and cell viability as per luminescent CellTiter-Glo assay; positive control: 100 μM Benzethonium-chloride; negative control: DMSO. A delta score reflects positive (synergistic) and negative (antagonistic) drug interactions. It is calculated based on a zero-interaction potency (ZIP) reference model and is computed using the synergyfinder R-package (details in Online Supplements). Waterfall plot: ranking of each combination based on the delta scores of the low dose ranges (1–300 nM) across all samples. Rank-sums over 13 cases significantly differed among combinations (I + P:63, I + B:60, I + O:56, P + B:51, O + B:24, O + P:19; p < 0.0001, one-way Friedman Anova, highest ranks for highest score values). Combinations of I + P (p = 0.015) and I + B (p = 0.04) were superior to P + B (Wilcoxon rank-sum test). O + B or O + P showed antagonistic relationships in most T-PLL. Four selected 2D plots illustrate the distribution of synergistic (red) or antagonistic (green) interactions over the entire dose range of all 13 cases (positive controls in red in upper right corners)

