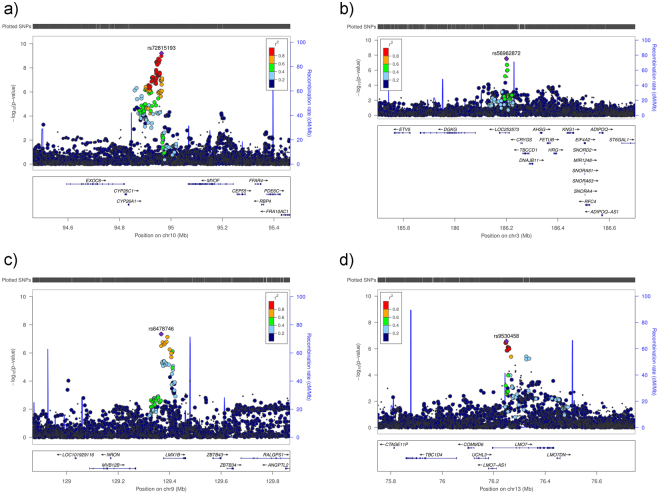
Figure 1.
Regional plots for the new risk loci identified in single variant analyses in this study. The most significantly associated SNPs in each region are marked as solid purple diamonds. Pairwise correlations (LD r2) between the top SNP and the other SNPs in a 400 kb flanking region are illustrated by different colours. Blue spikes show estimated recombination rates. (a) rs72815193 on chromosome 10 near MYOF, CYP26A1, and CYP26C (the most significant results were obtained in combined OAG and VCDR analysis conducted in combined Asians and European ancestry). (b) rs56962872 on chromosome 3 within LOC253573 (LINC02052), near CRYGS and TBCCD1 (the most significant results were obtained in combined OAG and VCDR analysis conducted in European ancestry). (c) rs6478746 on chromosome nine near LMX1B (the most significant results were obtained in combined OAG and CA in European ancestry). (d) rs9530458 on chromosome 13 within LMO7 (combined OAG data from ANZRAG and NEIGHBORHOOD). cM = centimorgan.

