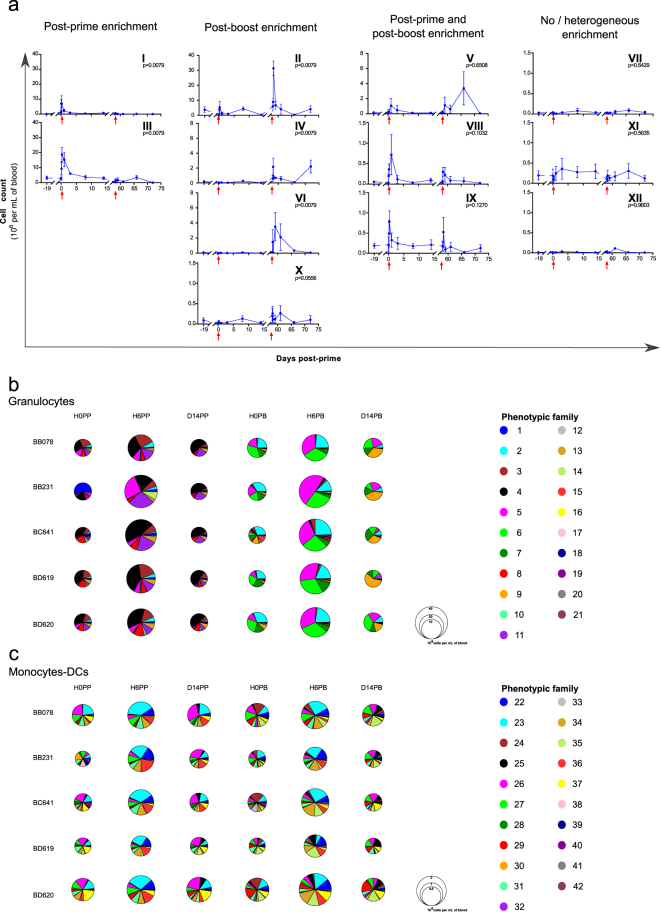
Figure 5.
Different enrichment of innate myeloid cells after first and second immunizations. (a) Phenotypic families sharing similar abundance profiles were gathered into kinetic families after hierarchical clustering based on abundance profiles with the Pearson correlation. Twelve kinetic families were defined and arbitrarily numbered from I to XII. They were further regrouped based on their kinetic pattern with an enrichment essentially post-prime, essentially post-boost, both after the prime and boost, or no or heterogeneous enrichment after each immunization. The mean abundance among the five animals is displayed ± standard deviation. The individual AUC after the prime (H3-D14PP) and boost (H3-D14PB) were calculated for each kinetic family and compared using a permutation test. The p-values are indicated and considered to be significant when p ≤ 0.01. Note that the scale of the Y-axis is specific to each kinetic family. The red arrows indicate the prime and boost injections. (b,c) Composition in phenotypic families of the granulocytes (b) and monocytes-DCs (c) compartment at H0PP, H6PP, D14PP, H0PB, H6PB and D14PB for each macaque. The size of the pie chart is proportional to the cell concentration. The color-code for each phenotypic families is identical for the pie-charts and the heatmaps.

