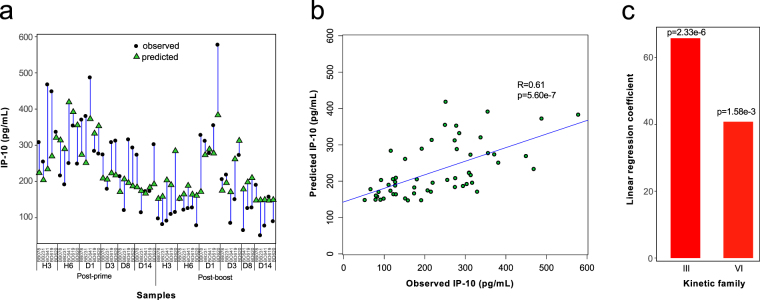
Figure 6.
Association of kinetic families with a direct biological measurement. (a) The relationship between kinetic family abundances and IP-10 plasma concentration was analyzed using linear regression. Iterative linear regressions were generated until all coefficients had a p-value ≤0.05. At each iteration, the coefficient having the highest p-value higher than 0.05 was removed. The differences between predicted vs. observed concentrations of IP-10 are shown. (b) The ELISA measured and linear regression predicted IP-10 concentrations are shown in a bi-plot representation. The Pearson correlation coefficient and p-value are indicated. (c) The linear regression coefficients of kinetic families III and VI, which are necessary and sufficient to predict IP-10 concentrations, are displayed along with their p-values.

