Figure 7.
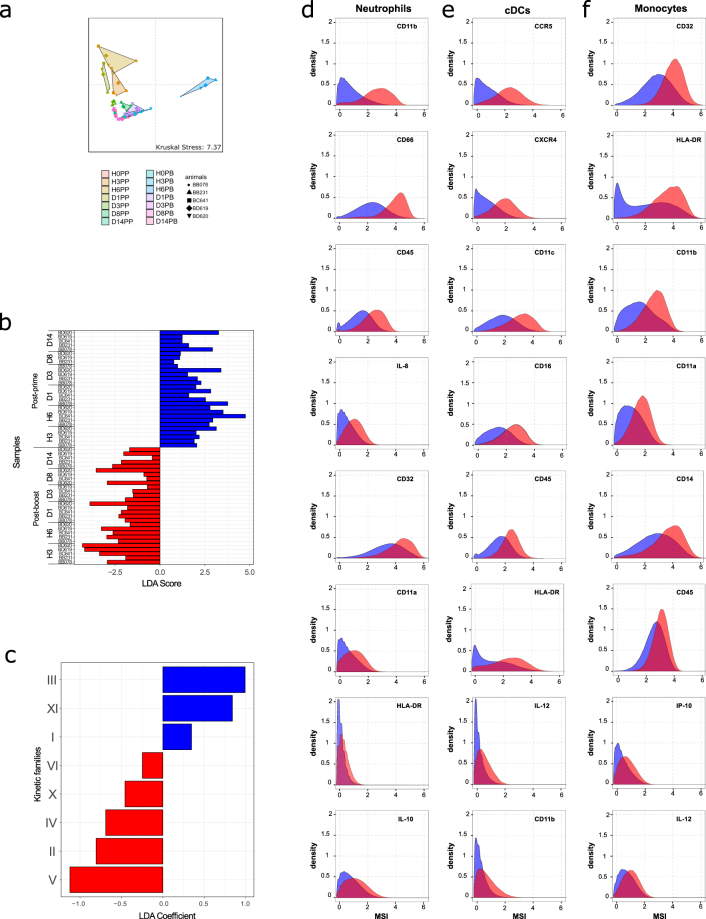
Visualization of and discrimination between post-prime and post-boost innate myeloid cell responses. (a) The Multidimensional Scaling (MDS) representation was calculated based on the abundance of each kinetic family. The Kruskal Stress is indicated and corresponds to the percentage of information lost during the dimensionality reduction process. Samples collected long before the prime injection (D-19PP) were not included. (b) Linear Discriminant Analysis (LDA) was performed after Least Absolute Shrinkage and Selection Operator (LASSO) (Supplementary Figure S11). Samples from the timepoints D-19PP, H0PP, and H0PB were not used for this analysis. The LDA scores of each sample are shown. The LDA score indicated whether a given sample was classified as post-prime (positive score) or post-boost (negative score). The samples colored in blue correspond to post-prime samples and the samples colored in red correspond to post-boost samples. (c) The LDA coefficients for each kinetic family are shown. (d–f) Kolmogorov-Smirnov (KS) distances of expression distribution densities were computed for each marker for neutrophils, cDCs, and monocytes (Supplementary Figure S12). This distance corresponds to the maximal difference between the distributions of marker expression in the two compared cell populations. KS distance is commonly used in flow cytometry analyses93. MSI histograms for the top 8 markers with the highest KS distance are displayed for (d) neutrophils, (e) cDCs, and (f) monocytes from kinetic families that discriminate between the post-prime (blue) and the post-boost responses (red) as defined in Fig. 7c. Histograms were built on the whole dataset and did not represent a particular sample (animal or timepoint).

