Fig. 1.
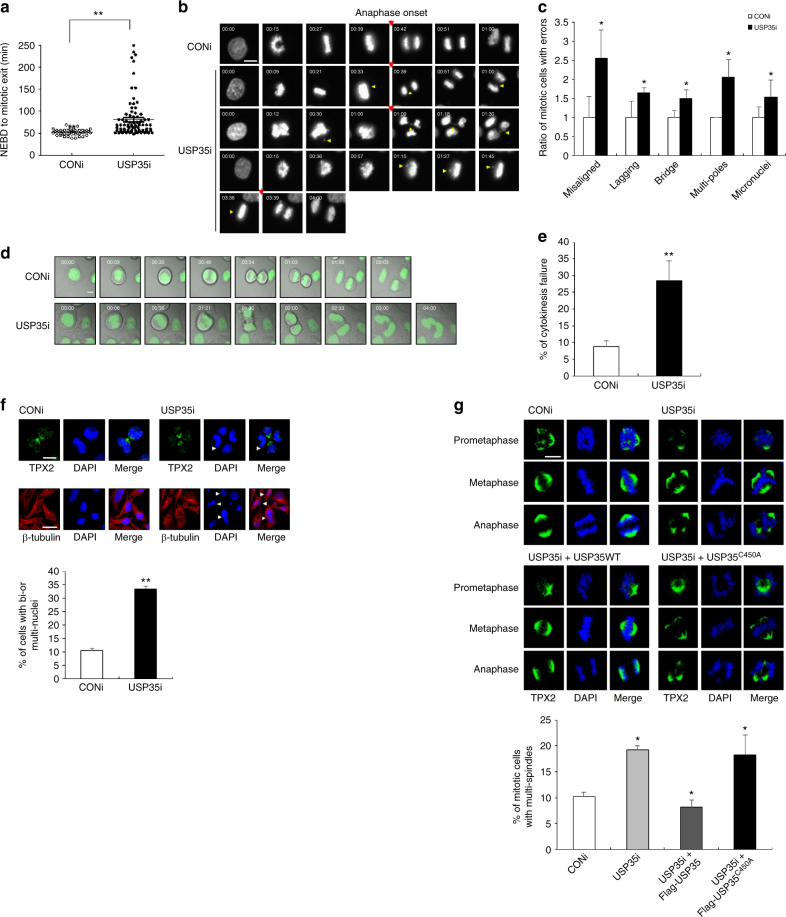
USP35 is required for faithful mitotic progression. a–e GFP-H2B-expressing HeLa cells transfected with a siRNA targeting USP35 (USP35i, n = 105) or a control siRNA (CONi, n = 64) were synchronized with thymidine and then released in a fresh medium. These cells were observed using time-lapse microscopy for 12 h, and images were captured every 3 min. The results were from three independent experiments. a The mitotic timing, defined as the time from NEBD to the mitotic exit, in the transfected cells. b Time-lapse microscopy of cells undergoing mitosis. Representative images are shown at the indicated times from NEBD (NEBD occurred at 00:00). The timing of anaphase onset is denoted by the red arrow. Yellow arrows indicate misaligned or lagging chromosomes, chromatin bridges, or improperly separated chromosomes. Scale bar = 10 μm. c Quantification of mitotic defects from time-lapse videos. The data are shown as ratios. d Time-lapse microscopy of cells undergoing mitosis and cytokinesis. Representative images were formed by merging phase contrast images and H2B-GFP fluorescence images. Scale bar = 10 μm e Quantification of cytokinesis failure from time-lapse videos. f HeLa cells were transfected with CONi or USP35i. Immunofluorescence staining was performed using a TPX2 antibody or a β-tubulin Cy3 antibody (top). Cells in bi- or multi-nuclei conditions were counted after immunofluorescence staining using a β-tubulin Cy3 antibody (bottom). One-hundred cells per group were examined from three independent experiments. Scale bar = 10 μm (top) or 20 μm (bottom). g HeLa cells were transfected with USP35i alone or in combination with Flag-USP35 or Flag-USP35C450A. Immunofluorescence staining was performed using a TPX2 antibody (top). Mitotic cells showing multi-spindles were counted after immunofluorescence staining (bottom). One-hundred cells per group were examined from three independent experiments. Scale bar = 10 μm. The data in parts a, c, e, f, and g represent the mean ± SD (*P < 0.05; **P < 0.005, t-test)

