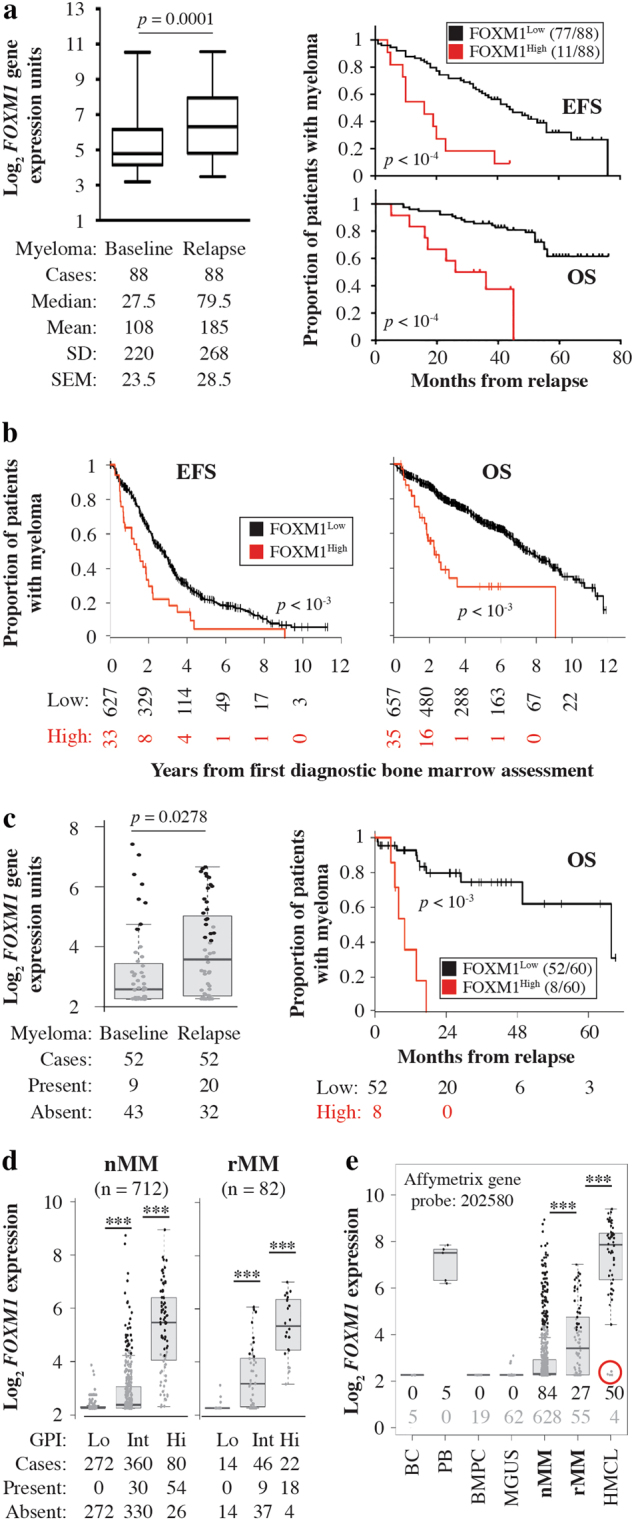
Fig. 1. Expression of FOXM1, a proliferation gene in normal and neoplastic plasma cells, is elevated in relapsed myeloma and predicts poor outcome in the subset of patients with peak expression levels.

a Shown on the left is a box plot of FOXM1 mRNA levels determined by microarray analysis (gene probe set 202580_x_at) of magnetic bead-sorted CD138+ myeloma cells collected from 88 patients of the UAMS Total Therapy 2 (TT2) trial at baseline (nMM) and relapse (rMM). Median FOXM1 expression is indicated by a black horizontal line within the box. The 25th and 75th percentiles of gene expression are indicated by lower and upper horizontal lines, respectively. Mean FOXM1 expression, standard deviation of the mean (SD) and standard error of the mean (SEM) are indicated below the plot. The increase in FOXM1 message was driven by 61 of 88 (69%) patients; in 20 patients FOXM1 mRNA was down at relapse compared to baseline and in 7 patients there was no change. Hence, upregulation of FOXM1 at relapse is a feature of the majority of cases, but it is not a universal phenomenon. Presented on the right is a Kaplan-Meier analysis of event-free survival (EFS) and overall survival (OS) of rMM patients stratified into cases containing FOXM1 message above the median (red curve, FOXM1High) or below the median (black curve, FOXM1Low). b High FOXM1 expression prognosticates poor survival of patients with nMM in the University of Heidelberg cohort. Myeloma patients were assigned to 2 groups distinguished by low FOXM1 mRNA levels (FOXM1Low) and high FOXM1 mRNA levels (FOXM1High) based on microarray measurements. The decline in EFS (left) and OS (right) after the first diagnostic bone marrow assessment is plotted. Survival was determined using Cox’s proportional hazard model. EFS and OS are significantly reduced in FOXM1High patients compared to FOXM1Low patients (p < 10−3). c FOXM1 expression in 52 paired nMM vs. rMM samples from the University of Heidelberg cohort is depicted to the left. Just like in the TT2 sample presented in (a), FOXM1 at relapse was up in the majority of patients (35/56, 63%), but down in 17 (30%) patients and unchanged in 4 patients. Shown to the right is a plot of OS, determined using Cox’s proportional hazard model, of patients with FOXM1High relapse (n = 8) and FOXM1Low relapse (n = 52). Maximally selected rank statistics was used to stratify patients with rMM using 6 as cutoff. The proportion of FOXM1High relapse (13.3%) is similar to that in panel a (12.5%). d Box plots comparing FOXM1 mRNA levels in CD138+ fractionated myeloma cells obtained from 712 patients with newly diagnosed disease (nMM) and 82 patients with relapsed disease (rMM) from the Heidelberg cohort. Based on the GPI score, patients were stratified into 3 distinct groups of low, intermediate and high proliferation. FOXM1 expression was different in these groups at p < 10−3 (indicated by 3 asterisks). The proportion of cases in which FOXM1 was present (expressed) or absent (not expressed), based on a cutoff determined by PANP, is indicated for all three groups below the plots. While FOXM1 was not present in the low proliferation group of both new and relapsed disease, it was more frequently present in rMM compared to nMM the intermediate (9/46 or 20% vs. 30/360 or 8%) and high (18/22 or 82% vs. 54/80 or 68%) proliferation groups. e Box plot depicting median FOXM1 expression in B cells (BC, n = 5), plasmablasts (PB, n = 5) and bone marrow plasma cells (BMPC, n = 19) from healthy individuals, or in CD138+ BMPCs from patients with monoclonal gammopathy of undetermined significance (MGUS, n = 62), newly diagnosed myeloma (nMM, n = 712) and relapsed myeloma (rMM, n = 54) from the Heidelberg cohort. A panel of human myeloma cell lines (HMCL, n = 54), which represent the terminal disease stage of plasma cell leukemia, is included for comparison. Presence and absence of FOXM1 is indicated for all groups using black and grey numbers, respectively. The circumstance that in 4 of 54 (7%) HMCLs FOXM1 was absent (indicated by red circle) suggests that malignant plasma cells may switch to a FOXM1-independent proliferation program, perhaps following secondary genetic change during serial in vitro propagation of cells
