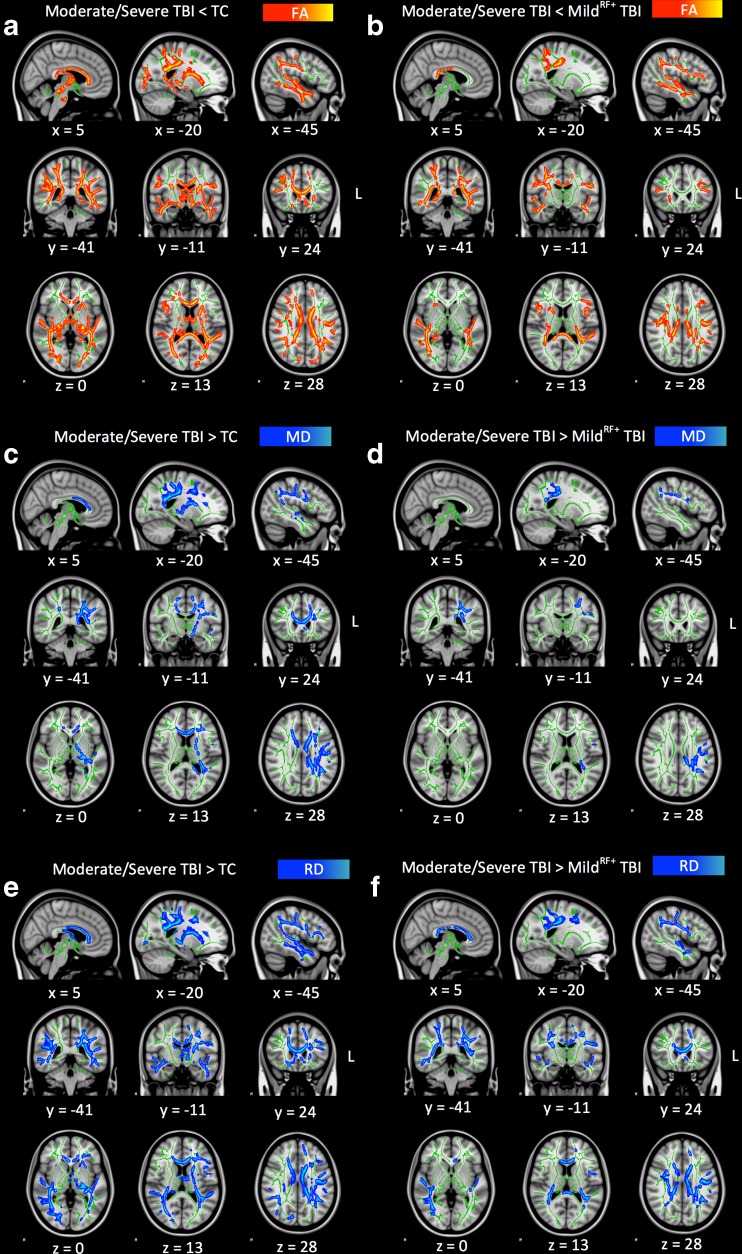
Fig. 1.
Voxel-wise comparison of FA, MD and RD maps using threshold-free cluster enhanced correction in TBSS. Note. Results of voxel-wise group comparisons showing the parts of the whole brain skeleton (at FA > 0.2, in green) with differences in terms of FA, MD and RD between the moderate/severe TBI group as compared to the TC group (Panels a, c and e, respectively) and mildRF+ TBI group (Panels b, d and e, respectively). Lower values in the moderate/severe TBI group as compared to other groups are displayed in red-yellow, while higher values are displayed in blue-lightblue. The results are overlaid on a MNI152 1 mm T1 brain in radiological convention (right = left), and for visualization purposes, regions in the whole brain skeleton with significant group differences were ‘thickened’ towards the full width of the white matter tract. TC trauma control group; TBI traumatic brain injury; FA fractional anisotropy; MD mean diffusivity; RD radial diffusivity

