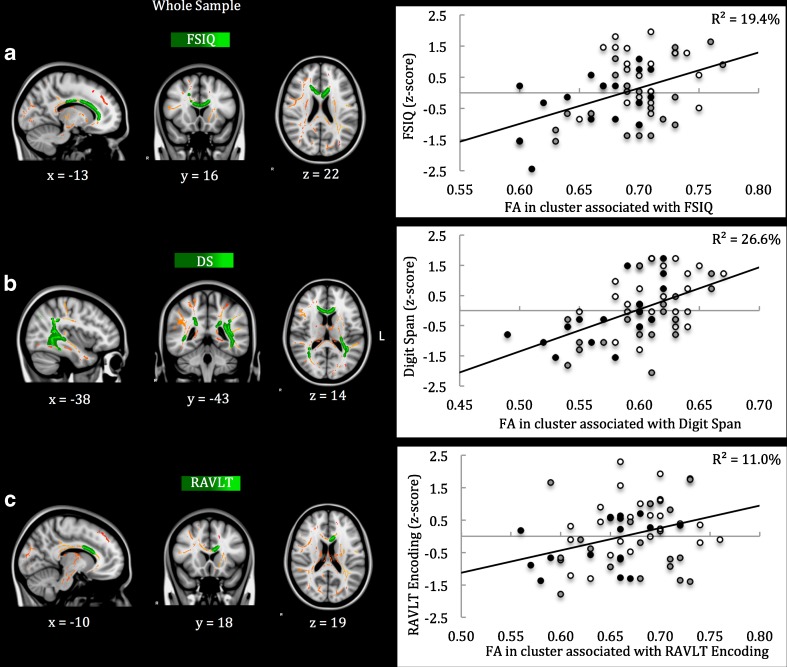
Fig. 2.
Regional associations between FA and functional outcome using threshold-free cluster enhancement correction in TBSS. Note. Regional associations are displayed (in green-light green) between FA in the cluster of affected white matter tracts and FSIQ (Panel a), Digit Span score (Panel b) and RAVLT Encoding score (Panel c). The cluster of white matter tracts affected by moderate/severe TBI is displayed in red-yellow. The results are overlaid on a MNI152 1 mm T1 brain in radiological convention (right = left), and for visualization purposes, regions in the cluster of affected white matter tracts with significant associations to functional outcome were ‘thickened’ towards the full width of the white matter tract. Color of the data point in the scatter plots refers to the trauma control group (white), mildRF+ TBI group (grey) and moderate/severe TBI group (black). FSIQ full-scale IQ; DS Digit Span; RAVLT Rey Auditory Verbal Learning Test

