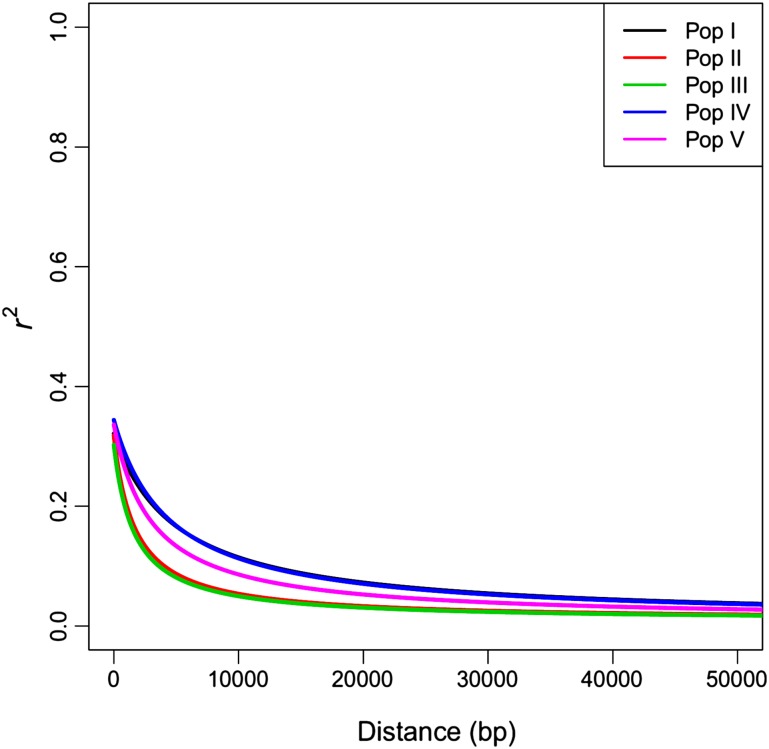
Fig. 2.
Decline in linkage disequilibrium, measured as r 2 against distance in base pairs (bp), for the five populations making up the multi-population (MP) perennial ryegrass training set. The lines are non-linear regression models estimated for each of Pop I–V. These are based on pairwise r 2 values between all SNPs mapped to the same scaffold, for all chromosomes within the population (Supplementary Figure S3)

