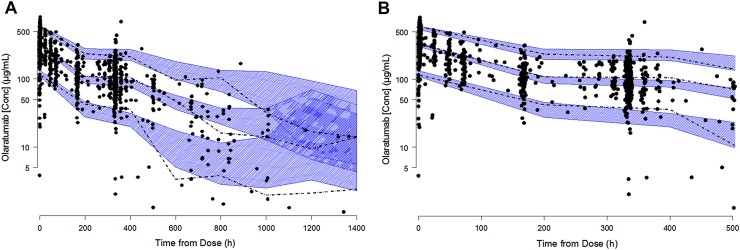
Fig. 2.
Visual predictive check of the final olaratumab population pharmacokinetic model. a Full time course of data available after dose. b Early time points where rich data are available. Black circles indicate observed data, dashed lines depict the observed 5th, 50th, and 95th percentiles, and the blue shaded areas define 90% confidence intervals of the 5th, 50th and 95th percentiles of the stimulated model predictions. Actual time from dose was rounded to the nearest 200 h to facilitate percentage calculation. Conc concentration

