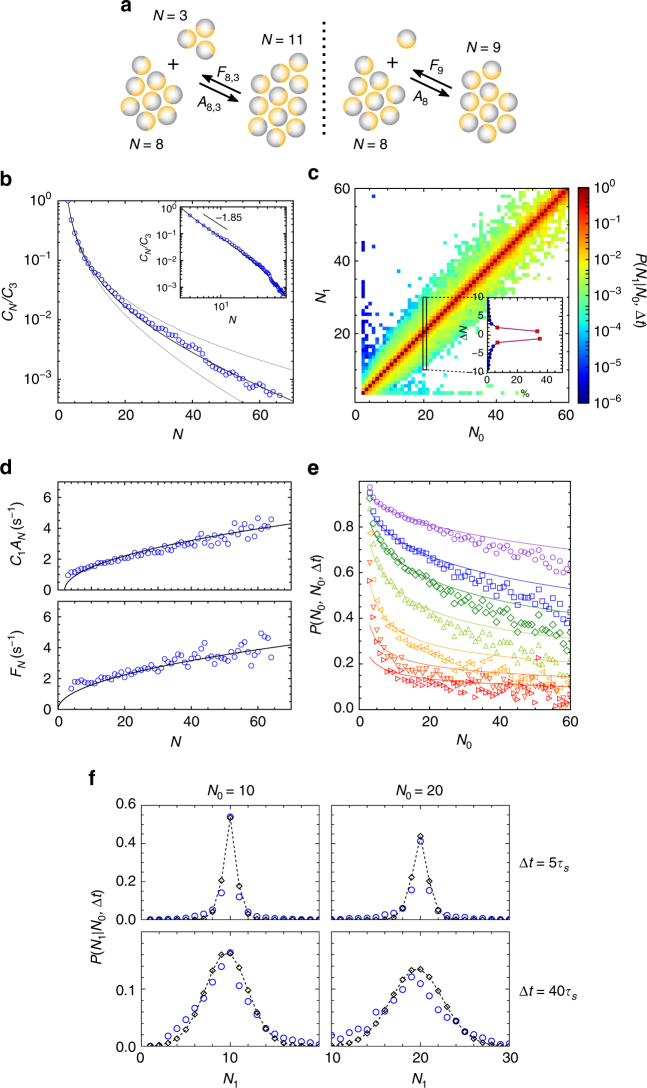
Fig. 2.
Aggregation–fragmentation process in active clusters. a Sketch of the events considered without and with the monomer approximation (left and right respectively). b–f Experimental data for activity v0 = 8.6 μm s−1 and area fraction Φ = 9%. b Cluster size distribution in semilog scale evidencing the exponential decay at large size. Symbols: experimental data and solid line: theoretical fit (see main text). The dashed lines show the effect of the 2% relative uncertainty on κ, obtained upon assuming a 10% relative uncertainty on all data points for CSD and rates. Inset: same data in loglog scale to emphasize the power law regime at small size. c Transition matrix showing the probability for a cluster of size N0 to have a size N1 after a time lag Δt = τs = 0.05 s. d Aggregation and fragmentation rates for monomeric events. Symbols: experimental data and solid line: theoretical fit (see main text). e Probability that a cluster of size N0 has the same size after a time Δt = 1, 2, 3, 5, 10, 20 and 40τs, from top to bottom. f Transition probability for N0 = 10 and 20, Δt = 5τs = 0.25 s and 40τs = 2 s. Blue circle: experimental data and black losange: prediction of Eq. (7)

