
Fig. 1.
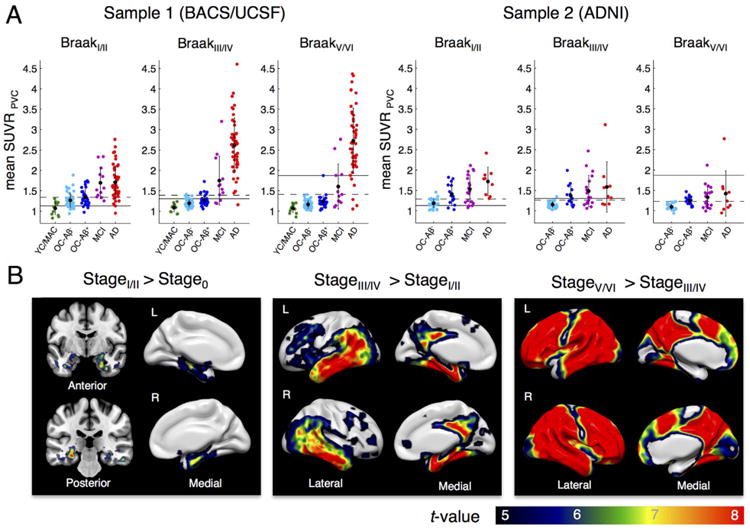
Braak ROI-based AV-1451 staging. A. Tau tracer uptake (mean SUVR, PVC, native space) for each Braak composite region of interest (ROI) by group shown for 2 samples: BACS/UCSF (left) and ADNI participants (right). Black dots display mean values, error bars denote SD. An initial subgroup of BACS/UCSF was used to derive Braak ROI thresholds to classify young controls (YC, N = 5), old controls (OC, N = 33) and AD patients (N = 15). The 4-stage classification proceeds from late to early Braak ROIs with subjects > SUVR threshold being assigned to the specific stage (thresholds: BraakV/VI > 1.87, BraakIII/IV > 1.30, BraakI/II > 1.13, Braak0 ≤ 1.13, see text for non-PVC thresholds). Thresholds for Braak classification are shown as solid lines. Cut points to discriminate patients from Aβ+ controls by an individual Braak ROI mean SUVR (Table 3) are shown as dashed lines. B. Voxel-wise 2-sample t-tests between subjects assigned to different stages (no PVC, MNI space) reveal a “spread” of tau from medial temporal lobe/hippocampus (stage I/II) to other temporal regions, posterior cingulate/retrosplenial cortex, parietal &frontal regions (stage III/IV), and finally higher neocortical regions (stage V/VI). Samples were merged for t-tests to reach adequate group sizes. Results are FWE corrected at voxel level (pvoxel < .05, k > 100). MAC = middle-aged controls.