
Fig. 2.
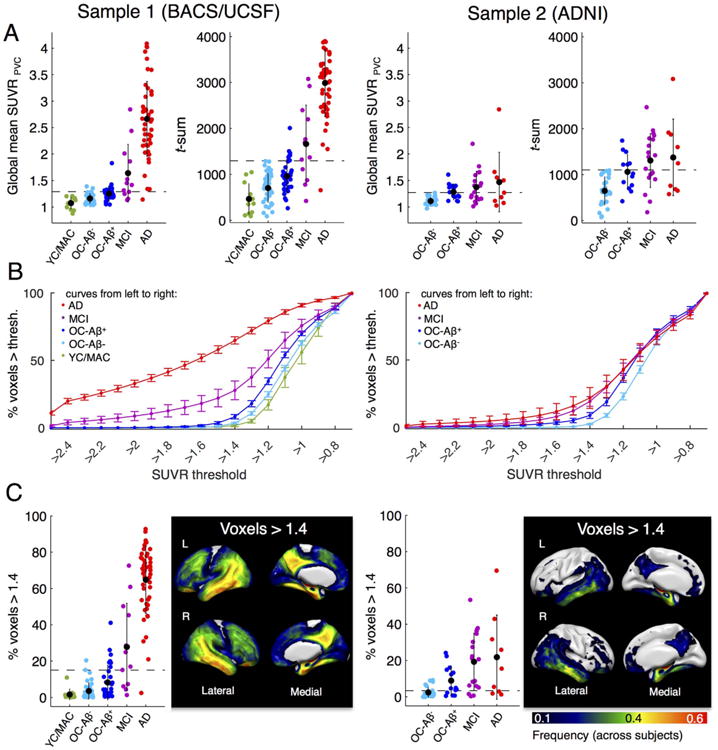
Whole-brain AV-1451 uptake measures by group. Left panel: BACS/UCSF participants. Right panel: ADNI participants. We examined three global tau PET measures. Cut points that best discriminate patients from Aβ- controls are displayed as dashed lines. A. Global mean SUVR (ROI-based, PVC) and sum of t-values across abnormal voxels relative to the young/middle-aged controls (MNI space, no PVC). Black dots are group means. Error bars denote SD. B. Percentage of voxels above an SUVR threshold (in MNI space, no PVC). An explicit mask excluding basal ganglia and thalamus was used. Note that the step-sizes are larger in the tails of the plotted graph. Error bars denote SEM. A threshold of 1.4 revealed best performance to discriminate AD/MCI patients from Aβ- controls. C. Scatterplot of subject data and frequency map that shows the location of voxels > 1.4 (frequency across all subjects).