
Fig. 3.
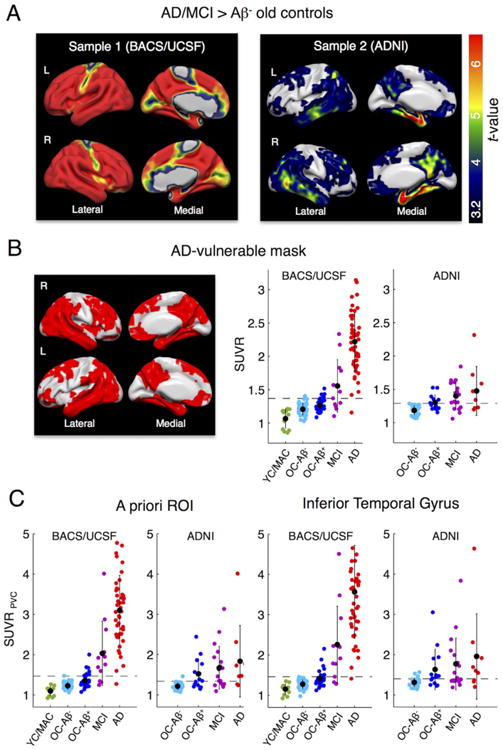
AD-specific tau tracer uptake and regional tau measures. A. To identify and compare AD-specific regions of high tau tracer retention within the 2 samples, we performed voxel-wise 2-sample t-tests between AD/MCI patients (all Aβ+) vs. Aβ- old controls (OC). Sample 1: Aβ+ MCIs/ADs (n = 60) patients from UCSF vs. BACS Aβ- controls (n = 41). Sample 2: Aβ+ MCIs/ADs (n = 28) vs. Aβ- controls (n = 28) from ADNI. Results are FWE-corrected at cluster-level (pcluster < .05, pvoxel < .001). Note that sample 1 included a variety of AD phenotypes. B. The overlap between significant t-test maps was used to create an AD-vulnerable mask (left). The mean SUVR across voxels in the AD-mask (in MNI space, no PVC) was calculated for both samples (right). Cut points that best discriminate patients from Aβ+ controls (Table 3) are displayed as dashed lines. C. Regional uptake was also determined in a composite a priori ROI of AD-signature regions as well as the inferior temporal gyrus after PVC. Black dots are group means. Error bars denote SD.