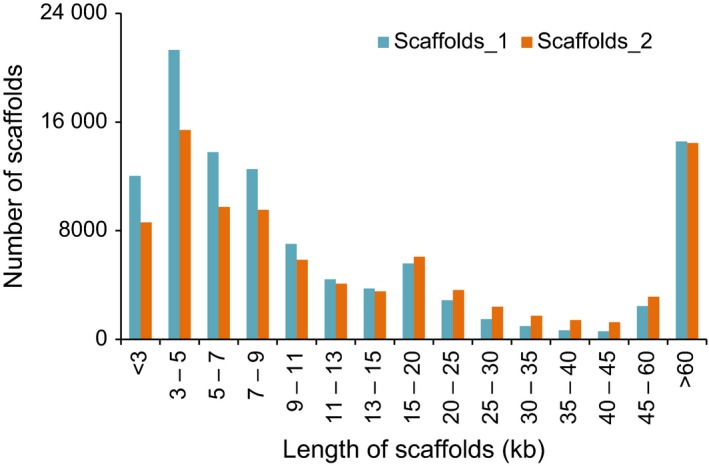
Figure 7.

Length distribution of sequences in scaffolds_1 and scaffolds_2 of Zangqing320. The x‐axis indicates the length of scaffolds (kb), and the y‐axis shows the number of scaffolds. Scaffolds_1 were assembled from second‐generation contigs; the gaps were filled with PacBio RS reads and resulted in scaffolds_2 (refer to Figure 1).
