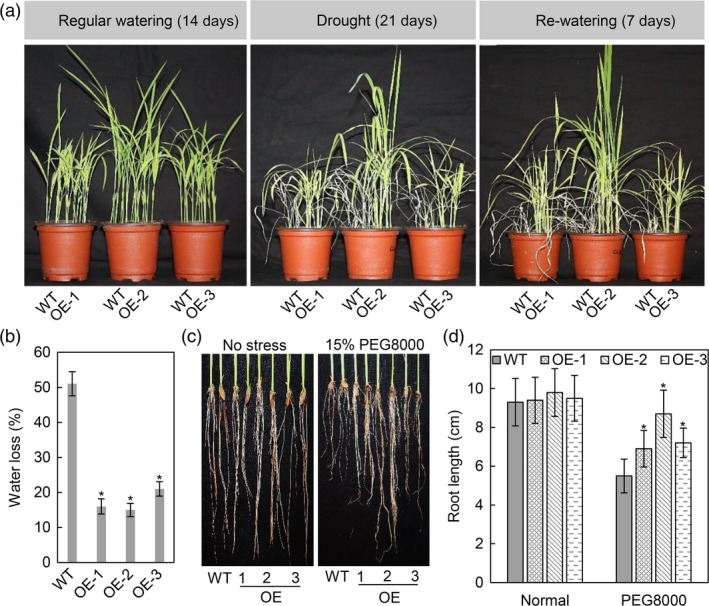
Figure 8.

Drought stress tolerance assessment in OsASR2 transgenic rice plants. (a) Phenotypes of WT and OE lines under regular watering, drought stress and re‐watering conditions. (b) Water loss of three T1 OE lines. Error bars indicate the SD (n = 3). Asterisks indicate P < 0.05 (*) in Student's t‐test analysis. (c) Phenotypes of roots from WT and OE lines under normal and osmotic stress. (d) Root length in response to the osmotic stress. Error bars indicate the SD (n = 3). Asterisks indicate P < 0.05 (*) in Student's t‐test analysis.
