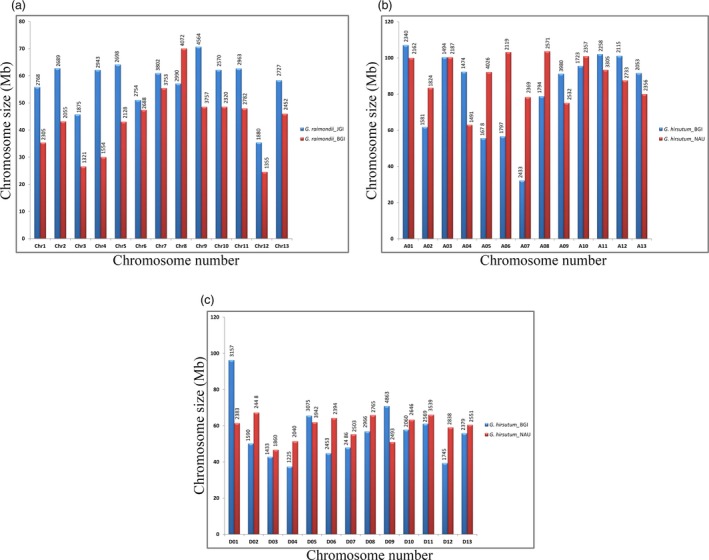
Figure 2.

Chromosome size distribution (y‐axis) and number of annotated genes (above each bar) of different Gossypium species. Differences in chromosome size and number of annotated genes (above each bar) by two independent studies between the sequenced genomes of (a) G. raimondii (Paterson et al., 2012 (blue); Wang et al., 2012 (red)); (b) At‐subgenome of G. hirsutum (Li et al., 2015 (blue); Zhang et al., 2015b (red)), and (c) Dt‐subgenome of G. hirsutum (Li et al., 2015 (blue); Zhang et al., 2015b (red)). These differences might be due to errors in their assemblies, which in turn also affects the various genome analyses among different cotton species. Currently, we need to devote more efforts in capturing, evaluating and fixing their misassemblies by developing quality control standards.
