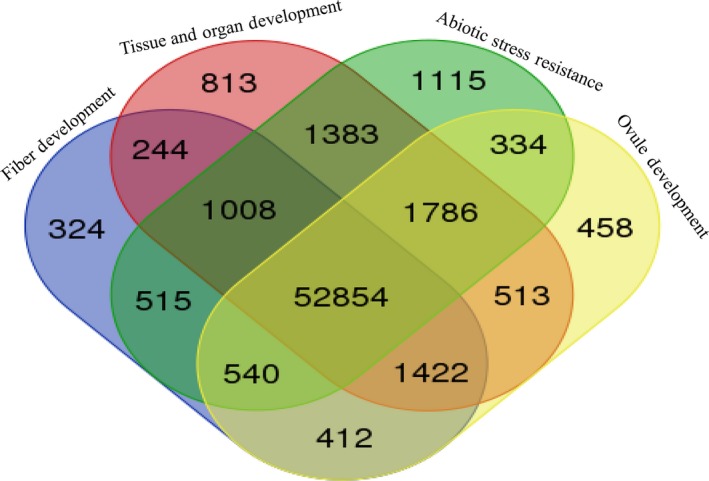
Figure 3.

A venn diagram of the differentially expressed genes during fibre development, tissue and organ development, abiotic stress resistance and ovule development. The functional distribution of annotated genes from G. hirsutum (Zhang et al., 2015b) highlights that 52 854 differentially expressed genes were commonly identified during fibre, organ, tissue and ovule development and resistance against abiotic stress. However, more genes were differentially expressed during stress resistance than during fibre and organ development.
