
Figure 2.
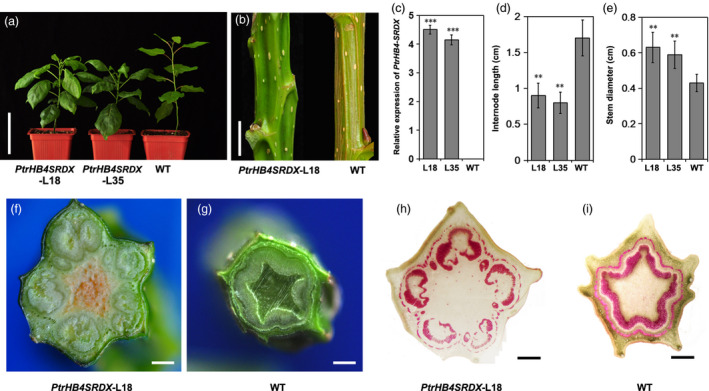
Repression of PtrHB4 disrupted secondary vascular tissue development. (a) Morphological phenotype of PtrHB4SRDX (Line 18 and Line 35) and WT plants. (b) Stems of PtrHB4SRDX and WT plants. (c) Expression levels of PtrHB4 in transgenic and WT plants. (d) Internode length and (e) stem diameter. Bars in (c), (d) and (e) are means ± SD of n = 3 biological replicates. Significance testing was conducted using the two‐sample t‐test (*P < 0.05, **P < 0.01 and ***P < 0.001). (f) and (g) Secondary vascular pattern in IN12 of PtrHB4SRDX and WT plants. (h) and (i) Cross sections of IN12 in PtrHB4SRDX and WT plants stained by phloroglucinol‐HCl. Bars: 10 cm in (a), 2 cm in (b), 5 mm in (f) and (g), 500 μm in (h) and (i).