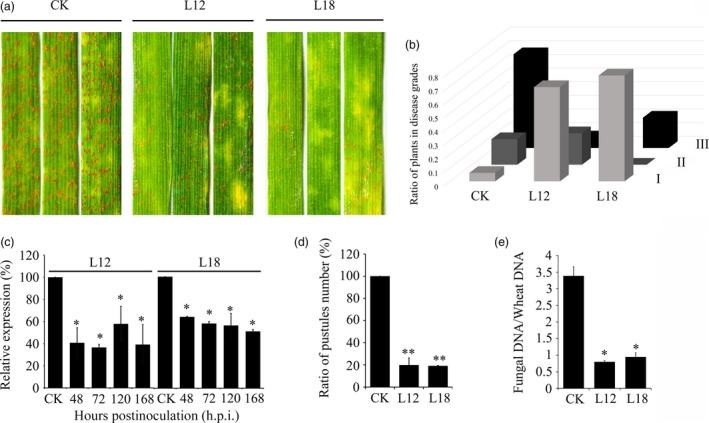
Figure 6.

Expression of PsCPK1 small RNA in wheat confers durable resistance to Pst. (a) Phenotypes of the second leaves of the third‐ and the fourth‐generation wheat plants at 14 dpi with Pst isolate CYR32. (b) The ratio of plants in disease grades. Phenotypes were scored to indicate the frequency of symptoms, as follows: I: 1–3; II: 4–6; III: 7–9. (c) Relative transcript levels of PsCPK1 in the second leaves of the fourth‐generation wheat plants at 48, 72, 120 and 168 h p.i. with Pst isolate CYR32. Values are expressed relative to the endogenous Pst reference gene PsEF1, with the empty vector (CK) set at 1. Values represent the means ± standard error of three independent samples. (d) Quantification of the uredial density in the CK‐, L12‐ and L18‐inoculated wheat plants at 16 dpi. (e) Q‐PCR measurement of fungal biomass. Ratio of fungal to wheat nuclear genomes using fungal PsEF1 and wheat TaEF1 genes, respectively, in plants treated with variants targeting fungal genes compared with controls. Genomic DNA extracted from the second leaf from three different plants at 7 dpi. Values represent the means ± standard error of three independent samples. Differences were assessed using Student's t‐tests. Asterisks indicate P < 0.05, and double asterisks indicate P < 0.01.
