
Figure 7.
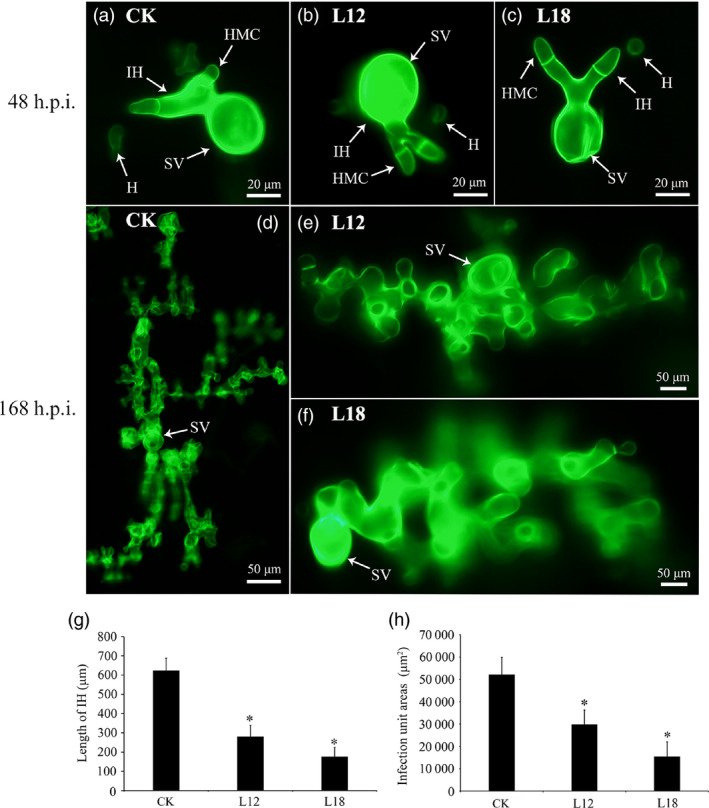
Histological changes in Pst growth in transgenic plants. (a–f) A microscopic examination revealed no obvious differences in the number of hyphal branches between the control plants (CK) and the transgenic plants (L12 and L18) at 48 h p.i. (a–c) and 168 h p.i. (d–f), respectively. (g) The hyphal lengths in the transgene lines (L12 and L18) were shorter than those observed in the control plants (CK) at 168 h p.i. (h) The colony sizes in the two transgenic plants (L12 and L18) were reduced compared with the sizes observed in the control plants (CK) at 168 h p.i. Differences were assessed using Student's t‐tests, and asterisks indicate P < 0.05.