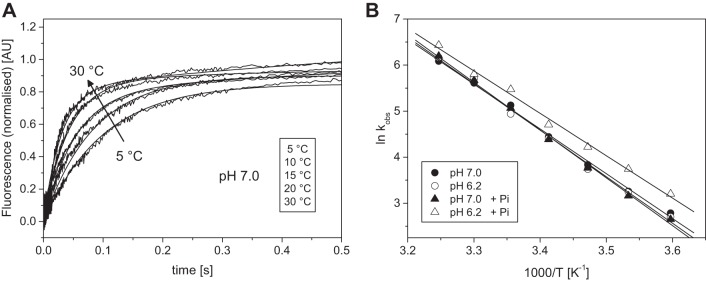
Fig. 4.
Temperature dependence of the ADP release from pyrAct.MassS1. A: normalized fluorescent transients observed when 0.5 µM pyrAct.MassS1 preincubated with 75 µM ADP was mixed with 8 mM ATP at different temperatures between 5 and 30°C in pH 7.0 buffer (selected transients are shown). The change in fluorescence was biphasic when observed over a time scale of 5 s; however, here only the initial fast phase is shown (fits superimposed). The kobs for the fast phase were 16.2, 26.0, 46.3, 85.0, and 273 s−1 for 5, 10, 15, 20, and 30°C, respectively. B: Arrhenius plot of the kobs of the ADP release rate constant of masseter at pH 7.0 and pH 6.2 in the absence and presence of 15 mM Pi. The linear fits (best fits superimposed) gave slopes of −9.72 ± 0.24 and −10.09 ± 0.33 K for pH 7.0 and 6.2, and −10.36 ± 0.23 and −9.20 ± 0.31 K for pH 7.0 + Pi and pH 6.2 + Pi, respectively. The activation energies (Ea) were calculated as 75.9 ± 4.1 and 84.7 ± 6.1 kJ/mol for pH 7.0 and 6.2 without phosphate, and 94.4 ± 5.0 and 88.9 ± 3.9 kJ/mol for pH 7.0 and pH 6.2, respectively, in the presences of phosphate.

